
 6 months ago
98
6 months ago
98
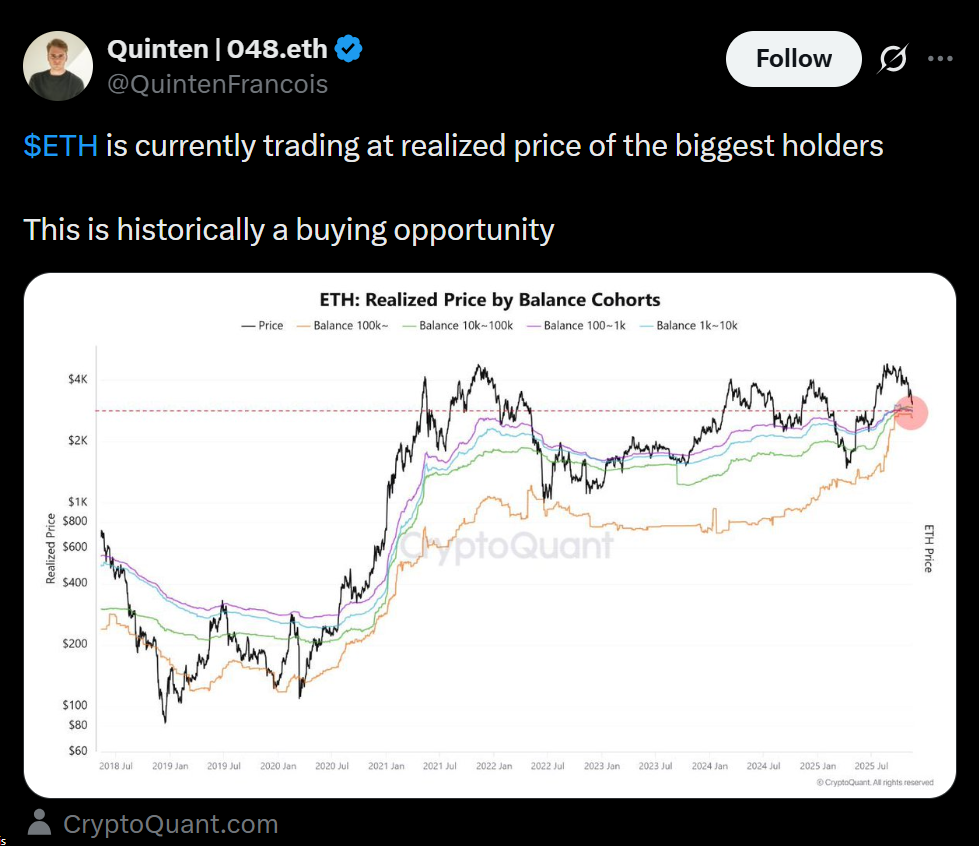
- ETH is trading near whale realized price — a level that has historically marked major bottoms.
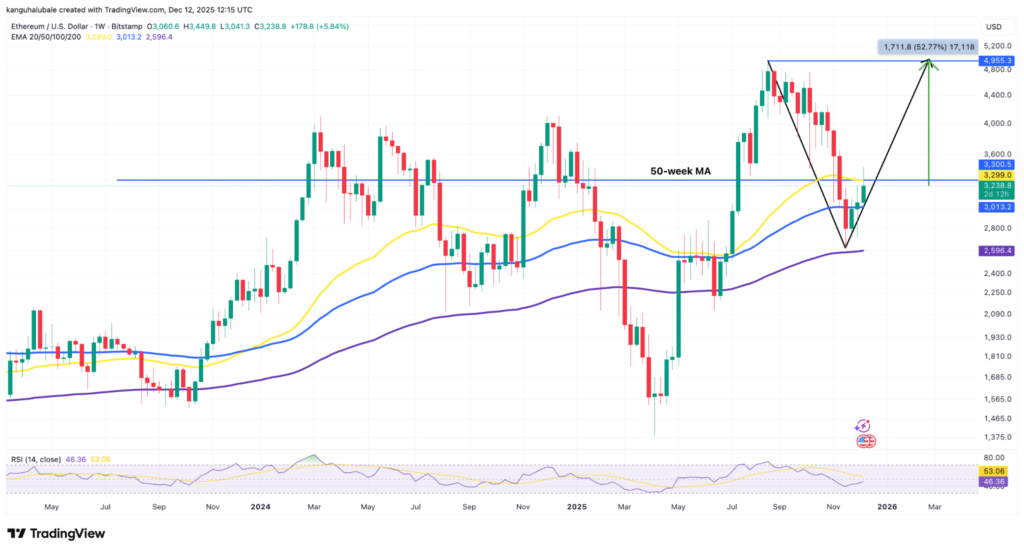
- Technical patterns including a V-shape and falling wedge point toward $5,000 ETH.
- Analysts expect a potential parabolic rally into 2026, with some targets even higher.
Ether (ETH) hovered around $3,242 on Friday, approaching a zone that has historically acted as a launchpad for massive rallies. According to CryptoQuant, ETH recently traded near the realized price of wallets holding 100,000+ ETH — the average cost basis of the largest on-chain investors.
This has happened only four times in the last five years, and each instance aligned with a major market bottom. One of those rebounds earlier this year triggered a 260% surge, sending ETH to its all-time high near $5,000.
Onchain analyst Quentin Francois called the current setup “historically a buying opportunity,” reinforcing growing bullish sentiment.
Falling Wedge + V-Shaped Recovery: Charts Flash Bullish Signals
ETH fell 45% from its October peak of $4,758 to its November low of $2,621, but the rebound since Nov. 22 has flipped technical momentum. ETH is now up more than 23% from its recent low and is retesting the 50-week SMA near $3,300.
Analysts say that a close above this level could ignite the final leg of a V-shaped recovery, putting the neckline target at $4,955 — essentially a full retrace to the all-time high.
A broader falling wedge pattern shown by analyst Satoshi Flipper supports the same outcome, projecting a breakout toward $4,800–$5,000 sooner than many expect.
Meanwhile, ETH’s inverse head-and-shoulders setup versus Bitcoin suggests an 80% ETH/BTC rally next year, which corresponds to an ETH price above $5,800 if Bitcoin remains stable.
Why This Matters: Perfect Conditions for a Parabolic Move
ETH’s strongest tailwinds include:
- Deep value signals from whale realized pricing
- A textbook bullish reversal pattern forming on higher timeframes
- Institutional accumulation via Ethereum treasury companies
- Potential return of ETF inflows in early 2026
While nothing is guaranteed, multiple high-confluence indicators are aligning — something ETH traders haven’t seen since the lead-up to the 2021 bull run.
The post Ether Nears Historic Buy Zone as Chart Patterns Signal a Run to $5,000 – Here Is Why Bulls Are Watching Closely first appeared on BlockNews.


 English (US) ·