
 1 month ago
25
1 month ago
25

On June 24, 2026, Ethereum sits at $1,670 with sellers firmly in control across all timeframes. Ethereum price today captures a market in retreat rather than consolidation, as Bitcoin dominance above 56% continues draining altcoin capital according to CoinGecko data. Bears are not letting go.
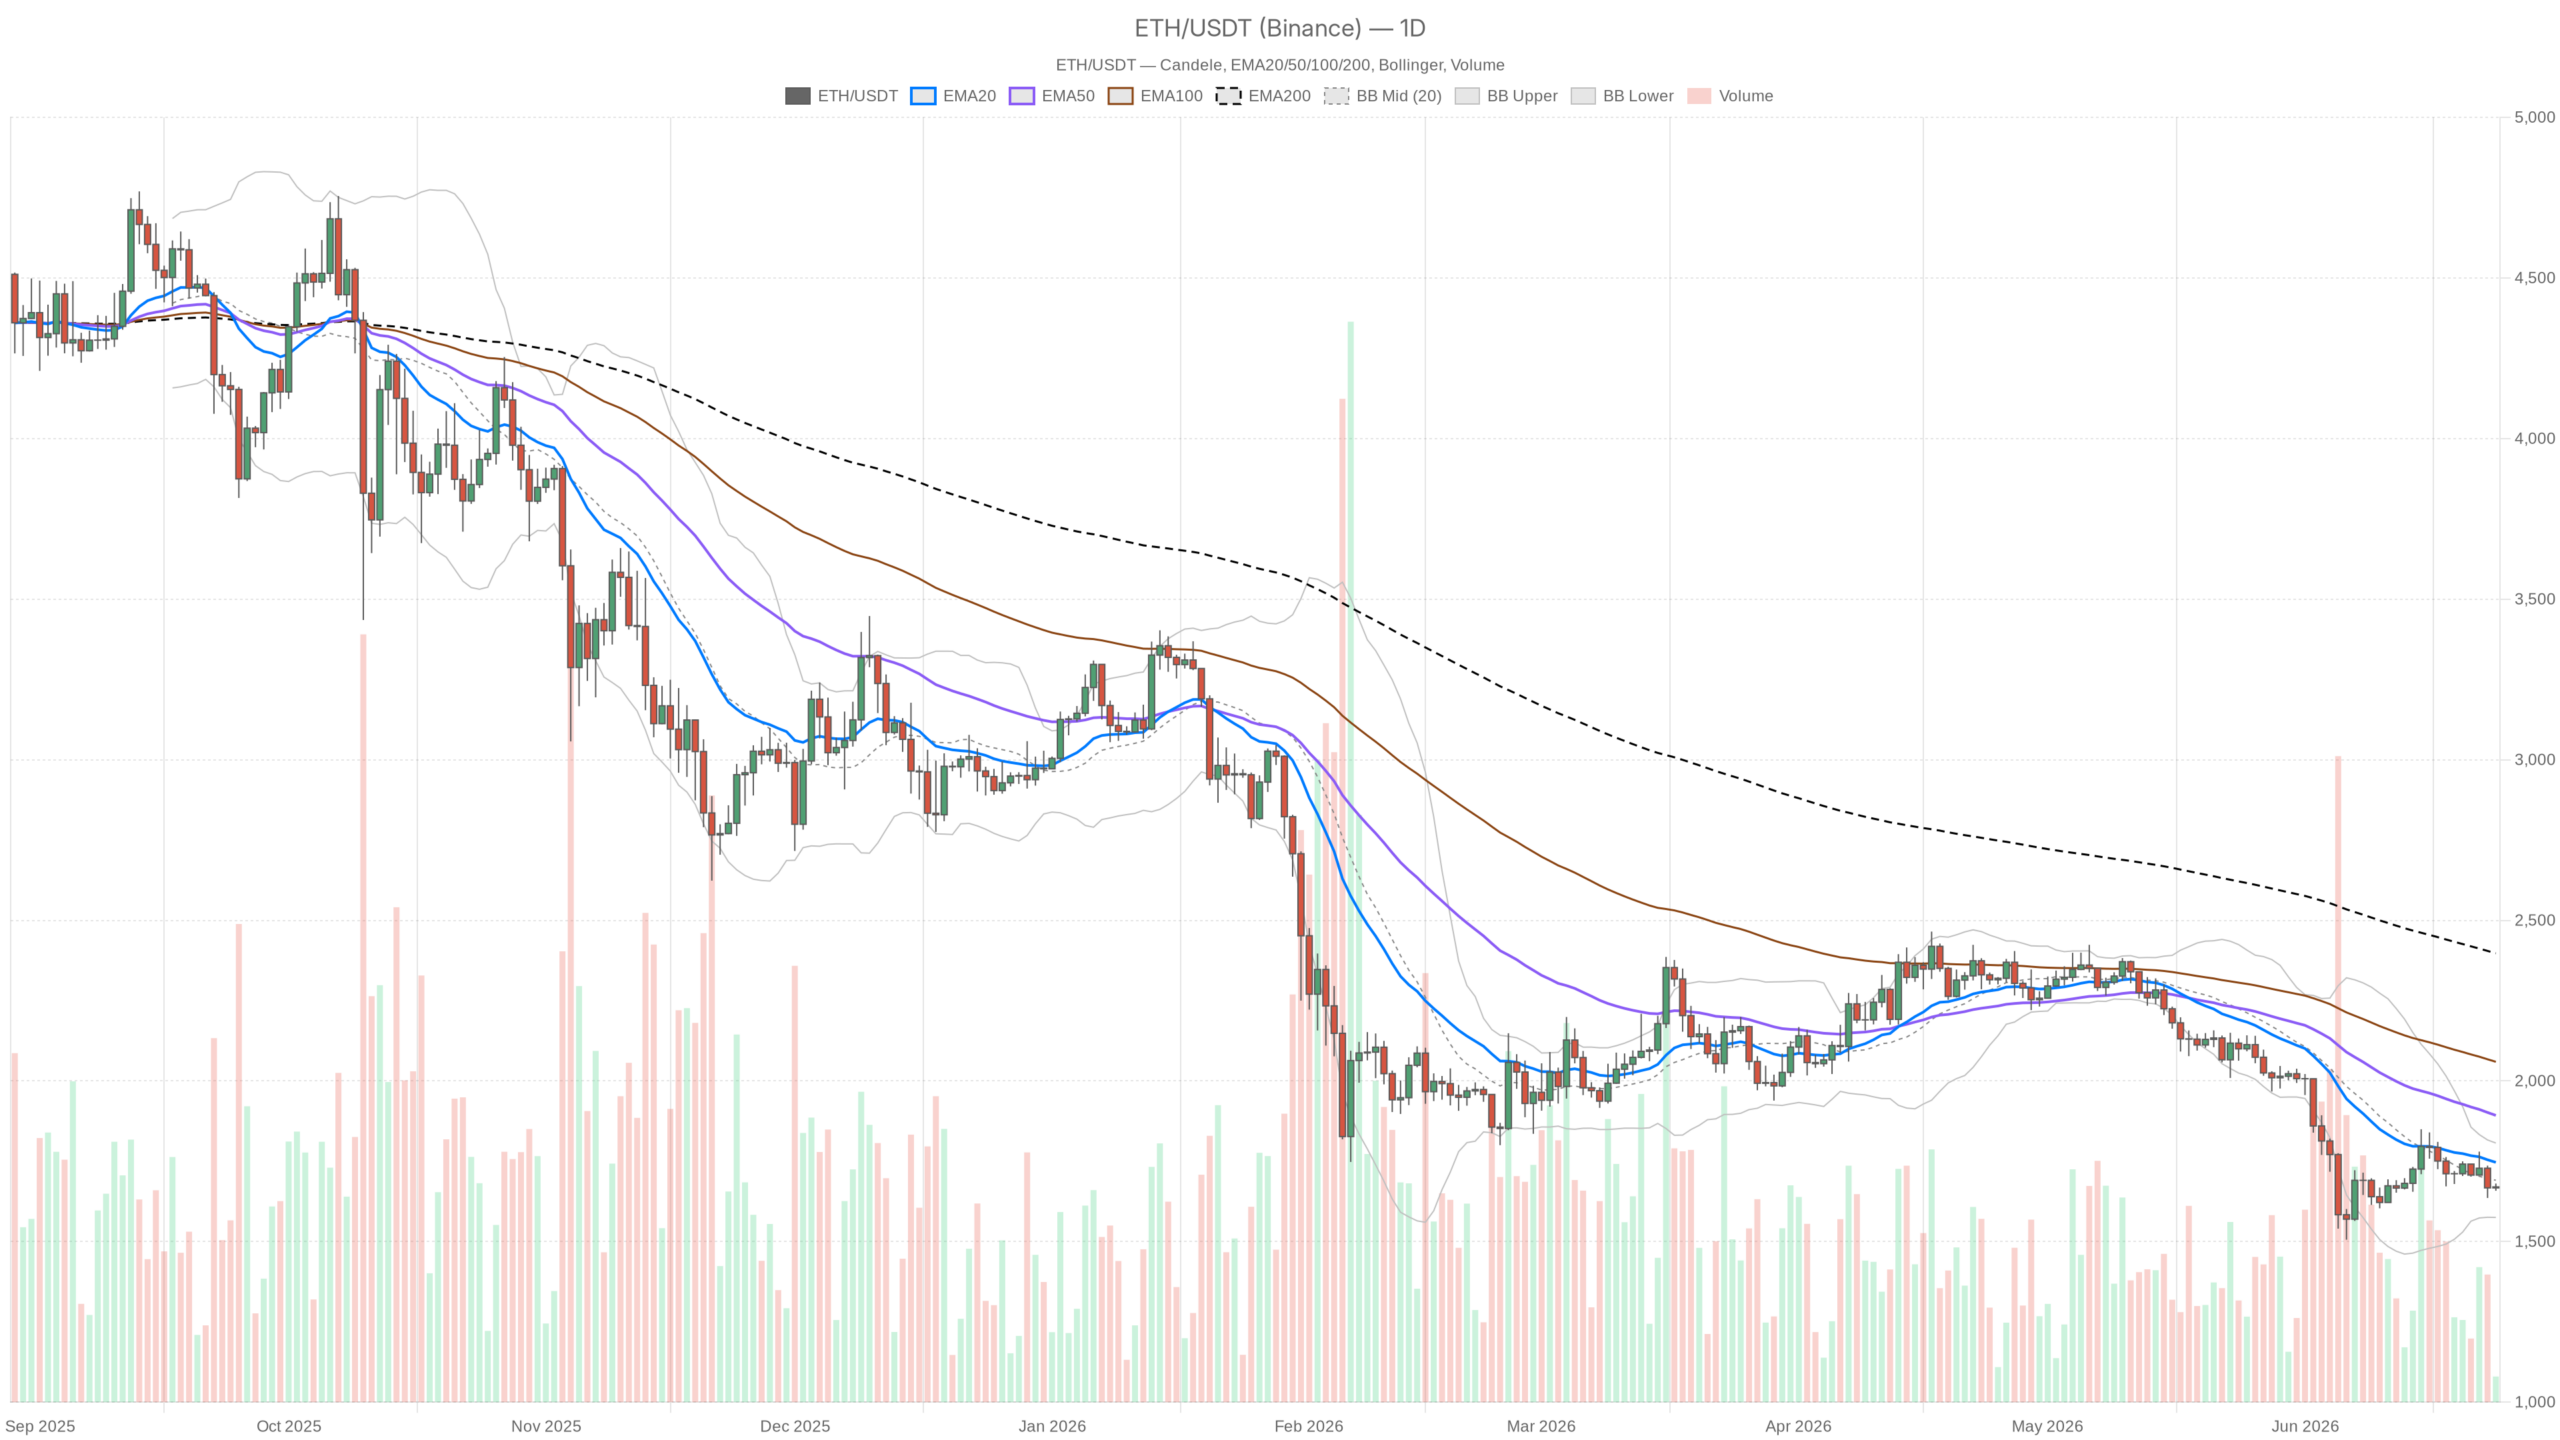 ETH/USDT — daily chart with candlesticks, EMA20/EMA50 and volume.
Key takeaways
- Ethereum is trading at $1,670, below all three daily EMAs — EMA20 at $1,746, EMA50 at $1,893, and EMA200 at $2,397.
- The Fear & Greed Index sits at 17 (Extreme Fear), while Bitcoin dominance remains above 56%, draining altcoin capital.
- Daily RSI at 37.44 suggests exhaustion without reaching historically oversold extremes that trigger sharp reversals.
- The $1,575 lower Bollinger Band is the nearest technical floor; a breakdown opens the path to $1,500.
- A sustained daily close above the EMA20 at $1,746 is required to challenge the bearish structure.
Meanwhile, the broader backdrop offers little comfort. The Fear & Greed Index has collapsed to 17 — deep into Extreme Fear territory — and total crypto market cap sits at roughly $2.23 trillion, barely moving in the last 24 hours. Volume is down nearly 15% on the day, meaning price stability is not demand-driven but simply the absence of aggressive selling. Fortune recently highlighted Ethereum’s price trajectory through late June, and the technical picture has not improved.
The Daily Chart Sets the Tone — And It’s Bearish
The daily chart confirms Ethereum is in a textbook bearish distribution phase with no reversal signal yet. ETH is trading at $1,670, sitting below all three key exponential moving averages: the EMA20 at $1,746, the EMA50 at $1,893, and the EMA200 at $2,397. That stacking alignment — price below a declining short-term average, itself below a declining medium-term average, far beneath the long-term mean — is textbook distribution. The market is trending down, and each rally attempt has failed to reclaim even the nearest dynamic resistance.
The daily RSI at 37.44 sits in the danger zone — weak enough to suggest exhaustion but not washed out enough to bet on a floor. The MACD line at -64.77 remains well below zero, confirming the entrenched downtrend. However, the histogram has turned positive at +13.39, indicating downward momentum is decelerating. That divergence is the first faint signal that bears may be losing urgency — but it is evidence of slowing, not reversal.
Bollinger Bands on the daily frame place the midline at $1,690 and the lower band at $1,575. Price hugging the lower half of the bands while below the midline confirms the sustained selling bias, with the upper band at $1,806 remaining a distant ceiling. Moreover, ATR at 67.31 means daily swings of roughly $67 are normal — any intraday move that looks dramatic is simply within expected volatility range.
The daily pivot structure is incredibly tight: PP at $1,669.55, R1 at $1,680.91, S1 at $1,658.63. ETH is essentially sitting on top of its own pivot. In this context, that reads as indecision at the margin of support — not a platform for a launch.
The 1-Hour Frame: A Micro-Recovery That Doesn’t Change Much
The hourly chart shows a minor deceleration in selling pressure, but the bearish structure remains intact. ETH at $1,670.71 sits below the EMA50 at $1,689 and the EMA200 at $1,713. The EMA20 at $1,672 is almost exactly at current price, meaning short-term momentum is flatlined — neither pushing higher nor collapsing. The hourly RSI at 44.8 is neutral to slightly weak, leaving room for further softness before any technical rebound becomes compelling.
The 1H MACD histogram has turned positive at +3.38, echoing the same tentative deceleration signal seen on the daily chart. However, this small improvement must be weighed against the bigger picture: the EMA200 on the hourly at $1,713 has been acting as a ceiling. Any intraday bounce that fails to reclaim that level on a closing basis is just noise within a downtrend. Furthermore, Bollinger Bands on the hourly are extremely compressed — upper band $1,677, lower band $1,654 — reflecting a market coiling for a directional move.
The 15-Minute Picture: Neutral Drift, Not Accumulation
The 15-minute chart is neutral across all indicators and provides no directional signal beyond short-term drift. RSI sits at 49.65 — dead center. The EMA20 and EMA50 are effectively flat and converging around $1,670-$1,671, suggesting zero short-term directional conviction. The MACD histogram has just ticked negative at -0.50, hinting that even minor intraday buying pressure is fading. This timeframe is useful only for execution: it gives precision for entries but offers no structural signal of its own.
DeFi Context: Activity Isn’t Bullish, But It’s Not Dead Either
On-chain DeFi activity on Ethereum is recovering at the protocol level, but this has not yet translated into price support. According to DefiLlama data, Uniswap V4 fees are up 138% over the last 30 days, and Fluid DEX has seen a near-174% fee increase over the same period. However, 1-day fee data for Uniswap V3 is down 38%, suggesting recent spot volumes are declining. Ethereum price today remains disconnected from on-chain fundamentals — a divergence that is itself a risk factor.
Bull Case: The Floor Is Close, But It Has to Hold
The bullish scenario depends entirely on Ethereum holding the $1,575 lower Bollinger Band as a technical floor. If ETH stays above that level and the daily MACD histogram continues expanding positively, a mean-reversion move targeting the daily midband at $1,690, then the EMA20 at $1,746, becomes credible. That said, the hourly MACD improvement would need to be sustained, and the daily RSI would need to recover above 40 to confirm momentum shift.
A reclaim of $1,713 on the 1H EMA200 would serve as an early execution signal for this scenario. Conversely, a daily close below $1,575 would invalidate the bullish case entirely, opening a path toward the $1,500 psychological level with very little technical support in between.
Bear Case: Structure Remains Intact, And It’s Selling Into Strength
The bear case remains the dominant scenario, supported by price structure, sentiment data, and volume trends. With price below all daily EMAs, sentiment at Extreme Fear, BTC dominance expanding, and volume declining, every bounce in this environment is a selling opportunity until proven otherwise. The daily EMA20 at $1,746 is the first real line in the sand. As long as price fails to close above it, any recovery is technically suspect.
Furthermore, a failure to break $1,680 on the 1H pivot R1 level — just $10 away — would keep bears firmly in control on shorter timeframes. The bear case would be invalidated by a sustained daily close above $1,746 with improving volume and RSI crossing back above 45. That has not happened.
Where Does This Leave Positioning?
Ethereum at $1,670 sits in a high-risk zone where neither aggressive shorts nor fresh longs are clearly justified. The balance of evidence — daily regime, EMA stack, sentiment, dominance trends — points toward continued pressure rather than imminent recovery. The modest MACD histogram improvement and oversold-adjacent RSI introduce enough uncertainty to make aggressive short entries uncomfortable at current levels. However, they do not justify fresh long exposure without clearer confirmation.
The most honest read of this setup is that ETH is in a high-risk, low-visibility zone. Volatility, as measured by ATR, is elevated enough to produce painful whipsaws in both directions. Anyone navigating this market should size positions accordingly, keep stops wide enough to survive the noise, and wait for timeframe alignment rather than chasing single-indicator signals.
The next 24-48 hours around the $1,658-$1,680 pivot range will be telling. Either buyers step in with genuine conviction, or the structure continues to erode quietly — and quiet erosion in a fear-driven market has a way of becoming sudden.
FAQ
What is driving Ethereum’s bearish pressure right now?
Three factors are compounding: Bitcoin dominance above 56% is draining altcoin capital, the Fear & Greed Index sits at 17 in Extreme Fear territory, and ETH trades below all three daily EMAs — a textbook bearish alignment with no reversal signal yet.
What is the key support level for Ethereum?
The daily lower Bollinger Band at $1,575 is the nearest meaningful technical floor. A daily close below that level would open a path toward the $1,500 psychological zone with very little technical support in between.
What would signal a trend reversal for Ethereum?
A sustained daily close above the EMA20 at $1,746 with improving volume and the RSI crossing back above 45 would provide the first credible signal of a bullish momentum shift. Until then, the bearish structure remains intact.
Disclaimer: This article is for informational purposes only and does not constitute financial advice, an investment recommendation, or a solicitation to buy or sell any financial instrument or cryptocurrency. The analysis provided is not indicative of future results. Investing in crypto assets and financial markets carries a high risk of capital loss. Always do your own research (DYOR) and consult a qualified financial advisor before making any decision.
Article produced with the assistance of artificial intelligence and reviewed by the editorial team.


 English (US) ·