
 3 hours ago
10
3 hours ago
10
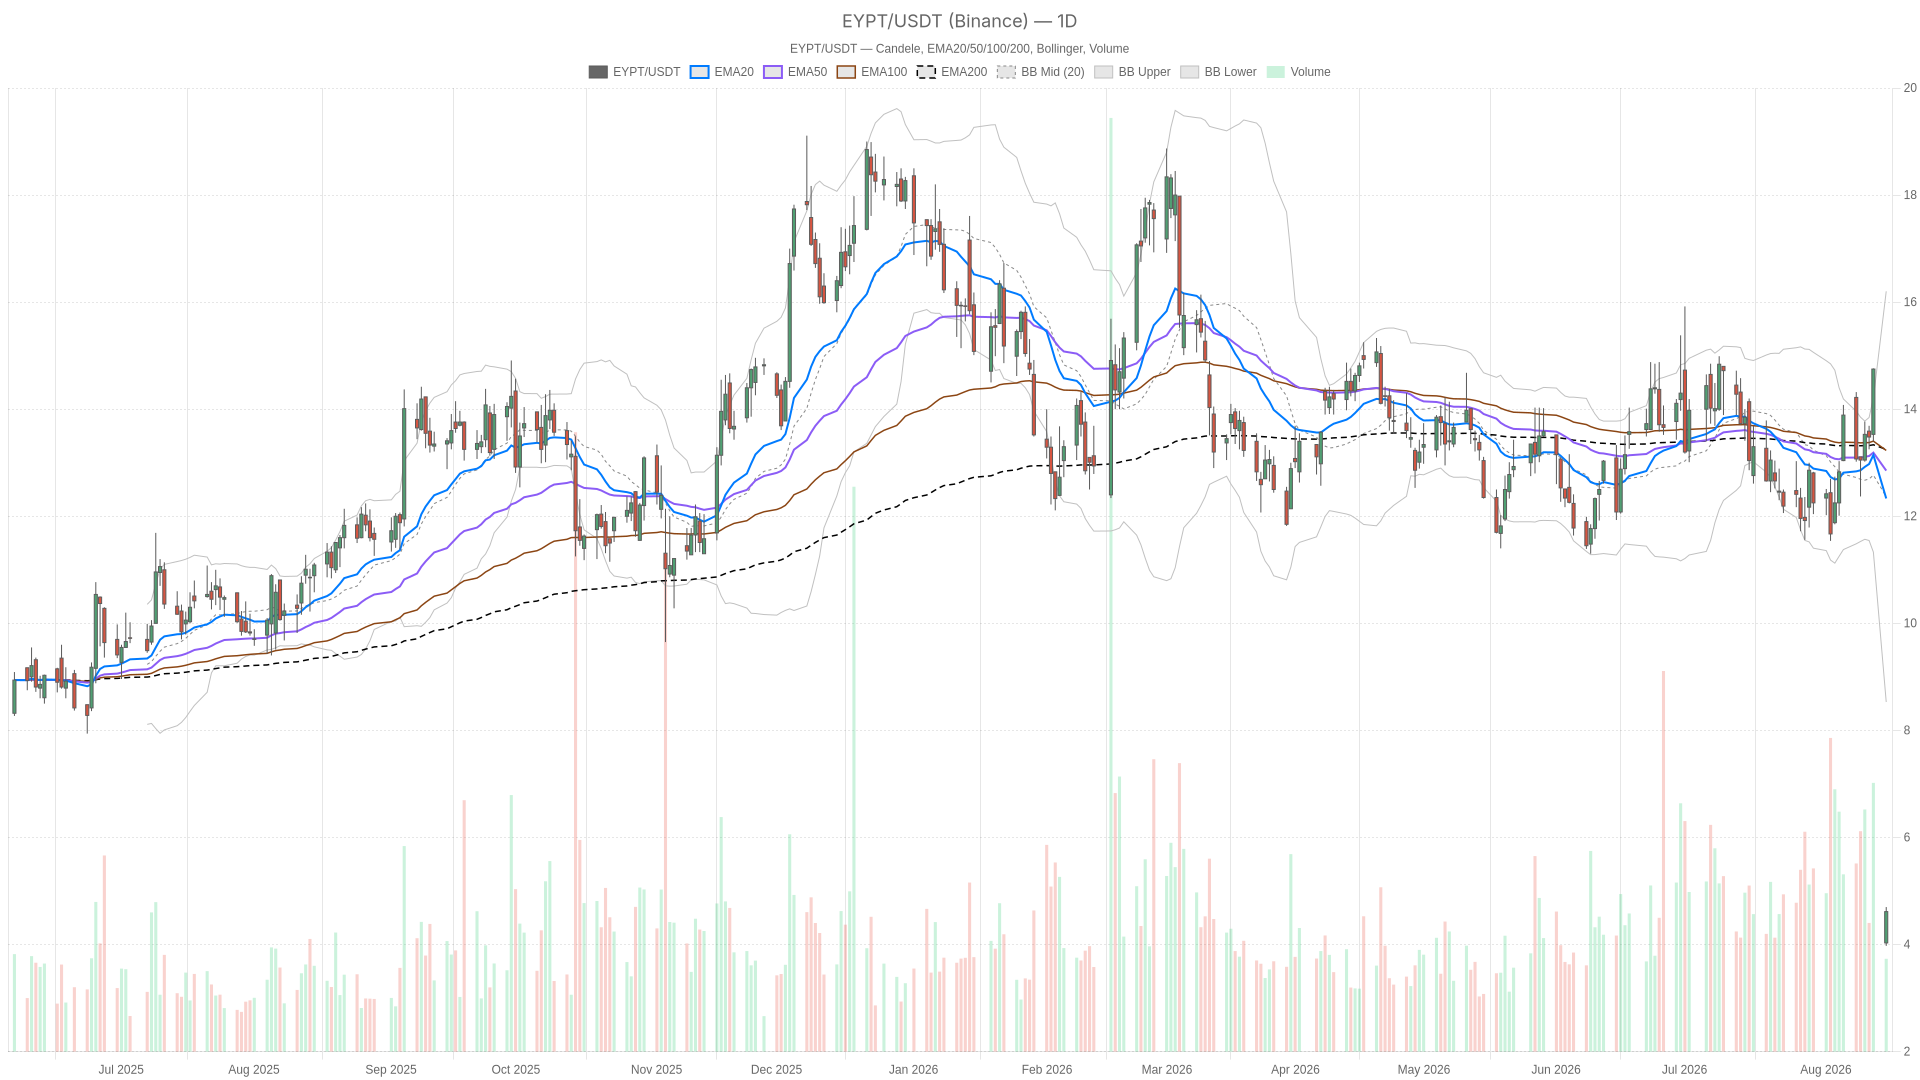
EyePoint, Inc. stock is showing one of its most stressed technical setups in recent memory. The stock closed at $4.62 after opening at $4.03, with a $3.98 low and a $4.70 high. That range signals an aggressive oversold rebound, yet the higher-timeframe trend remains firmly bearish.
 EYPT — daily chart with candlesticks, EMA20/EMA50 and volume.
Key takeaways
- EyePoint, Inc. stock closed at $4.62, rebounding from a session low of $3.98.
- The daily RSI14 reads 24.63, while the 1-hour RSI14 drops to an extreme 13.85.
- Price trades far below the daily EMA20 of $12.33, the EMA50 of $12.85, and the EMA200 of $13.25.
- The daily ATR14 of 1.66 points to unusually high single-session volatility.
- Daily support sits at $4.16, with $4.89 as the first resistance level.
Daily trend: EyePoint, Inc. stock stays bearish but stretched
The daily trend is firmly bearish, but the move is now deeply stretched relative to its own moving averages. Price closed at $4.62. The EMA20 sits at $12.33, the EMA50 at $12.85, and the EMA200 at $13.25. In other words, EYPT is trading roughly two-thirds below its own medium and long-term averages.
That gap reflects a violent repricing rather than a normal pullback. The daily ATR14 reads 1.66, which is extremely wide relative to a stock near $4.60. In practical terms, single-session swings can now represent a third or more of the share price. That level of volatility raises the stakes for both bulls and bears timing entries around EYPT in the near term.
RSI and MACD: oversold across every timeframe
Momentum confirms the bearish daily bias, while also flagging a stock stretched to an unusual degree. The daily RSI14 sits at 24.63, already in oversold territory. The daily MACD line reads -0.56 against a signal of -0.18, producing a negative histogram of -0.37. That combination shows sellers still in control, even near depressed indicator levels.
On the 1-hour chart, the picture intensifies rather than calms down. The RSI14 drops to 13.85, an extreme oversold reading. The MACD line sits at -1.51 with a histogram of -1.10. This confirms the daily bearish view rather than weakening it, since momentum accelerated lower before the recent bounce attempt.
Meanwhile, the 15-minute RSI sits at 15.08, still deeply oversold. However, the MACD histogram narrows to -0.34 from the 1-hour reading of -1.10. That narrowing suggests short-term selling pressure is decelerating, even if the broader momentum backdrop stays negative.
This is where the timeframes genuinely diverge. The daily and hourly charts both confirm a bearish regime with strong negative momentum. Yet the freshest 15-minute data shows early signs of stabilization. In other words, the trend remains down, but the pace of the decline appears to be losing some force at the margin.
Bollinger Bands confirm extreme volatility
Bollinger Bands reinforce the volatility story, with price trading well below the daily lower band. The daily mid-band sits at $12.37, while the lower band reads $8.53. That means the current $4.62 close sits far beneath the lower band itself. This is a rare and extreme condition, typically associated with capitulation-style selling rather than routine consolidation.
On the 1-hour chart, the lower band at $5.74 confirms the same story, with price still trading beneath it. Notably, when price trades outside its own bands by this margin, mean-reversion bounces become statistically more likely. That holds true even within a dominant downtrend.
Pivot levels frame the short-term execution
Pivot levels offer useful reference points for short-term positioning, with price trading just above the daily pivot. On the daily chart, the pivot sits at $4.43, with resistance at $4.89 and support at $4.16. Price is currently trading above the daily pivot, a modest positive sign for intraday buyers.
On the 1-hour chart, the pivot is at $4.57, with R1 at $4.68 and S1 at $4.51. The stock is sitting comfortably inside that narrow band. The 15-minute chart shows an even tighter range, with pivot at $4.59, R1 at $4.66, and S1 at $4.54.
Overall, this compression suggests the market is pausing near recent highs to digest the sharp reversal off the $3.98 low. The 15-minute structure is mainly a timing tool rather than a trend signal.
Bullish scenario for EyePoint, Inc. stock
A constructive case for EyePoint, Inc. stock requires the rebound from the $3.98 low to extend meaningfully. If price holds above the daily pivot at $4.43 and pushes through $4.89, oversold RSI readings across all three timeframes would support a further relief rally.
A move like that would likely need sustained volume. The current bounce is still occurring far below every major EMA. Therefore, any bullish continuation should be treated as a corrective bounce within a broader downtrend, until price reclaims the 12-13 EMA cluster.
Bearish scenario and invalidation
The bearish case remains the dominant technical narrative. The daily MACD histogram is still negative, and price is trading far beneath the daily Bollinger lower band. Both signs point to continued downside risk.
On the other hand, a failure to hold the daily support at $4.16, or a break back below the $3.98 low, would likely reassert the downtrend. That would invalidate the current bounce attempt. In that scenario, the deeply oversold RSI readings would simply reflect a stock continuing to fall rather than one preparing to reverse.
Closing take
EyePoint, Inc. stock presents a mixed picture, not a clean directional setup. The daily regime is bearish with extreme technical damage. At the same time, a short-term bounce has produced a strong reversal candle and some early momentum deceleration on the 15-minute chart.
Volatility remains elevated across every timeframe, with the daily ATR alone representing a substantial share of the current share price. Positioning around this name therefore calls for caution. The key question is whether the daily pivot and $4.89 resistance can hold. The alternative is a retest of $4.16 support and the recent $3.98 low. Overall, the setup favors patience over conviction until the conflict between trend and short-term price action resolves more clearly.
FAQ
What is the current EyePoint, Inc. stock price?
EyePoint, Inc. stock closed at $4.62, after opening at $4.03 and reaching a low of $3.98 and a high of $4.70.
Is EyePoint, Inc. stock oversold?
Yes. The daily RSI14 reads 24.63, while the 1-hour RSI14 drops to 13.85 and the 15-minute RSI sits at 15.08. These readings all fall in oversold territory.
Where are the key support and resistance levels for EYPT?
Daily support sits at $4.16, with the recent low at $3.98. The first resistance level is $4.89, above the daily pivot of $4.43.
Is the broader trend for EyePoint, Inc. stock bullish or bearish?
The higher-timeframe trend remains bearish. Price trades far below the EMA20 of $12.33, the EMA50 of $12.85, and the EMA200 of $13.25.
Disclaimer: This article is for informational purposes only and does not constitute financial advice, an investment recommendation, or a solicitation to buy or sell any financial instrument or cryptocurrency. The analysis provided is not indicative of future results. Investing in crypto assets and financial markets carries a high risk of capital loss. Always do your own research (DYOR) and consult a qualified financial advisor before making any decision.
Article produced with the assistance of artificial intelligence and reviewed by the editorial team.






 English (US) ·