
 3 hours ago
17
3 hours ago
17

Target Corporation stock (TGT) enters a pivotal week at $152.94, just below its daily pivot and only fractionally off Wednesday’s high. The daily trend remains bullish. Shorter timeframes, however, show fatigue ahead of an imminent earnings report.
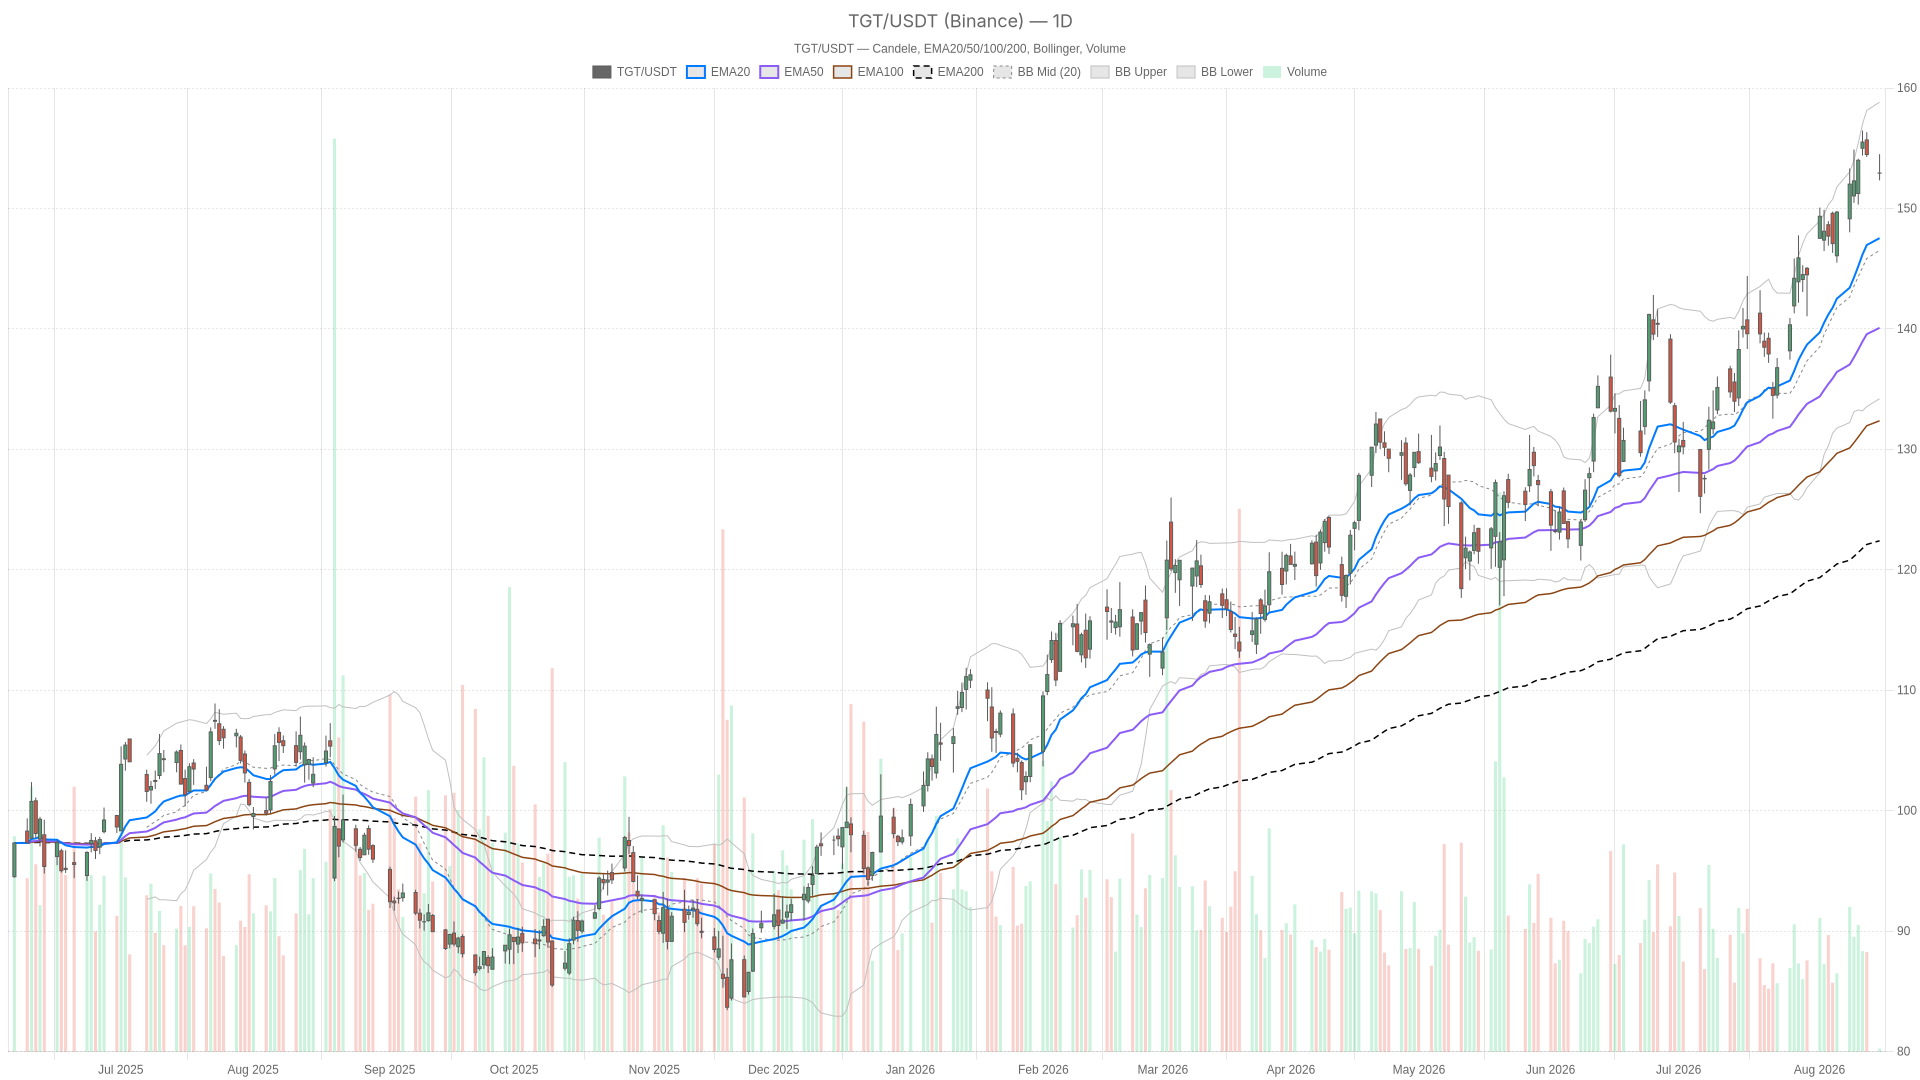 TGT — daily chart with candlesticks, EMA20/EMA50 and volume.
Key takeaways
- Target Corporation stock trades at $152.94, below its daily pivot of $153.26 but near Wednesday’s high.
- Daily EMAs are stacked bullishly: price holds above the EMA20 at $147.53, the EMA50 at $140.09, and the EMA200 at $122.41.
- Daily RSI14 reads 66.59 with a positive MACD, while the 1H and 15m charts show fading momentum.
- Immediate resistance sits at $154.19 (R1), while immediate support sits at $152.01 (S1).
- An imminent earnings report could quickly resolve the two-way tension.
Daily Structure for Target Corporation Stock: Momentum Strong, But Not Overheated
The daily structure confirms a healthy, well-established uptrend with momentum that is strong but not overheated. Notably, daily RSI14 sits at 66.59, firmly bullish without reaching the classic overbought zone above 70. Buyers remain in control, yet there is still runway before momentum turns stretched. The MACD agrees, with its line at 4.88 above the signal at 4.49 and a positive histogram of 0.39. Momentum is still expanding, even if the pace has moderated slightly.
Meanwhile, volatility and positioning add context. Price at $152.94 sits between the Bollinger mid band at $146.51 and the upper band at $158.82. That leaves room to extend higher before testing the top of the statistical range. The ATR14 of 3.68 confirms elevated but manageable daily volatility, consistent with an active trend. The daily pivot sits at $153.26, with resistance at $154.19 (R1) and support at $152.01 (S1).
1H and 15m: A Short-Term Cooling Within the Larger Trend
The shorter timeframes show a cooling phase inside the larger trend, not a reversal. In contrast, the tone shifts on the 1H chart. Price at $152.87 trades below its EMA20 at $153.88 but remains above the EMA50 at $152.26. It also sits well above the EMA200 at $144.98. The regime is neutral, and RSI14 at 44.63 reflects hesitation rather than conviction. The MACD has flipped negative, with the line at 0.26 below the signal at 0.72 and a histogram of -0.46. Intraday buyers have lost some grip after the recent advance.
At the same time, the 15m chart reinforces the softness. RSI14 has dropped to 38.15, while price trades beneath both the EMA20 at $153.64 and the EMA50 at $154.12. The MACD histogram is negative at -0.12. Price also hugs the lower Bollinger band at $152.01. A tight 15m pivot cluster — pivot at $152.87, resistance at $152.94, support at $152.81 — shows how compressed intraday trading has become. This is a market pausing to digest gains, but the lack of short-term thrust is notable.
Where the Conflict Lies
The core conflict is an intact daily uptrend against fading momentum on the 1H and 15m timeframes. The daily trend is bullish and unbroken. Meanwhile, the 1H and 15m charts show mild technical weakness. This pattern is common during a pullback inside an uptrend, and it does not automatically invalidate the bullish thesis. However, it does make the next 24 to 48 hours a test. Traders should watch whether dip-buyers return near daily support or whether short-term weakness spreads into the daily structure.
The Bullish Scenario for Target Corporation Stock
The bullish case reasserts itself only if Target Corporation stock reclaims the 1H EMA20 near $153.88 and holds above the daily pivot at $153.26. From there, a push through daily resistance at $154.19 (R1) would open the door toward the upper Bollinger band at $158.82. That would realign short-term price action with the dominant daily uptrend.
Meanwhile, the fundamental backdrop is supportive. Coverage this week has highlighted Target’s Q1 performance as impressive relative to peers in the large-format grocery and general merchandise space. Separate reporting notes the company’s push toward a more cohesive AI strategy under a new Chief AI Officer. Neither datapoint guarantees price direction, but both feed a constructive undertone.
The Bearish Scenario for Target Corporation Stock
The bearish case turns serious if Target Corporation stock loses daily support at $152.01. Therefore, a break below the 1H EMA50 at $152.26 would suggest the pullback is deepening rather than stabilizing. Continued negative MACD readings on the 1H and 15m charts would reinforce that view. The next meaningful references would then become the daily EMA20 at $147.53 and the Bollinger mid band at $146.51.
Moreover, earnings timing adds pressure. Target reports imminently, and market coverage describes the stock as “on fire” but facing “a big test”. Any disappointment on results could accelerate a move toward those lower levels quickly. The daily ATR14 already signals above-average volatility.
Closing Take
The daily trend on Target Corporation stock remains bullish, but earnings create genuine two-way risk. Overall, the technical picture stays bullish on the daily timeframe. Trending EMAs, positive MACD, and RSI with room before overbought territory all support that view. In contrast, the 1H and 15m charts show a short-term cooling phase.
For now, positioning into earnings carries real risk in both directions. The broader trend argues for patience with dips, while the shorter-term signals argue for caution around the reaction. Volatility is likely to rise once numbers land. Until that catalyst clears, near-term direction should stay uncertain.
FAQ
What is the current price of Target Corporation stock and where does it sit relative to key levels?
Target Corporation stock trades at $152.94, just below its daily pivot at $153.26. Immediate resistance sits at $154.19 (R1), while immediate support sits at $152.01 (S1).
Is the daily trend on Target Corporation stock bullish or bearish?
The daily trend is bullish. Price holds above the EMA20 at $147.53, the EMA50 at $140.09, and the EMA200 at $122.41. Daily RSI14 reads 66.59 with a positive MACD.
Why do the shorter timeframes look weaker?
The 1H and 15m charts show fading momentum. On the 1H, price trades below its EMA20 at $153.88 with RSI14 at 44.63 and a negative MACD. The 15m RSI14 has dropped to 38.15.
What are the key levels to watch around earnings?
Bulls need a hold above the daily pivot at $153.26 and a push through $154.19 (R1). A break below $152.01 (S1) would open the way toward the daily EMA20 at $147.53 and the Bollinger mid band at $146.51.
Disclaimer: This article is for informational purposes only and does not constitute financial advice, an investment recommendation, or a solicitation to buy or sell any financial instrument or cryptocurrency. The analysis provided is not indicative of future results. Investing in crypto assets and financial markets carries a high risk of capital loss. Always do your own research (DYOR) and consult a qualified financial advisor before making any decision.
Article produced with the assistance of artificial intelligence and reviewed by the editorial team.





 English (US) ·