
 1 hour ago
11
1 hour ago
11
FGI Industries Ltd. stock spiked intraday to $19.93 before settling at $15.45 after a massive +360.87% Q2 2026 earnings beat. Revenue missed marginally by -0.36%. The violent repricing has pushed daily RSI above 92, raising urgent sustainability questions.
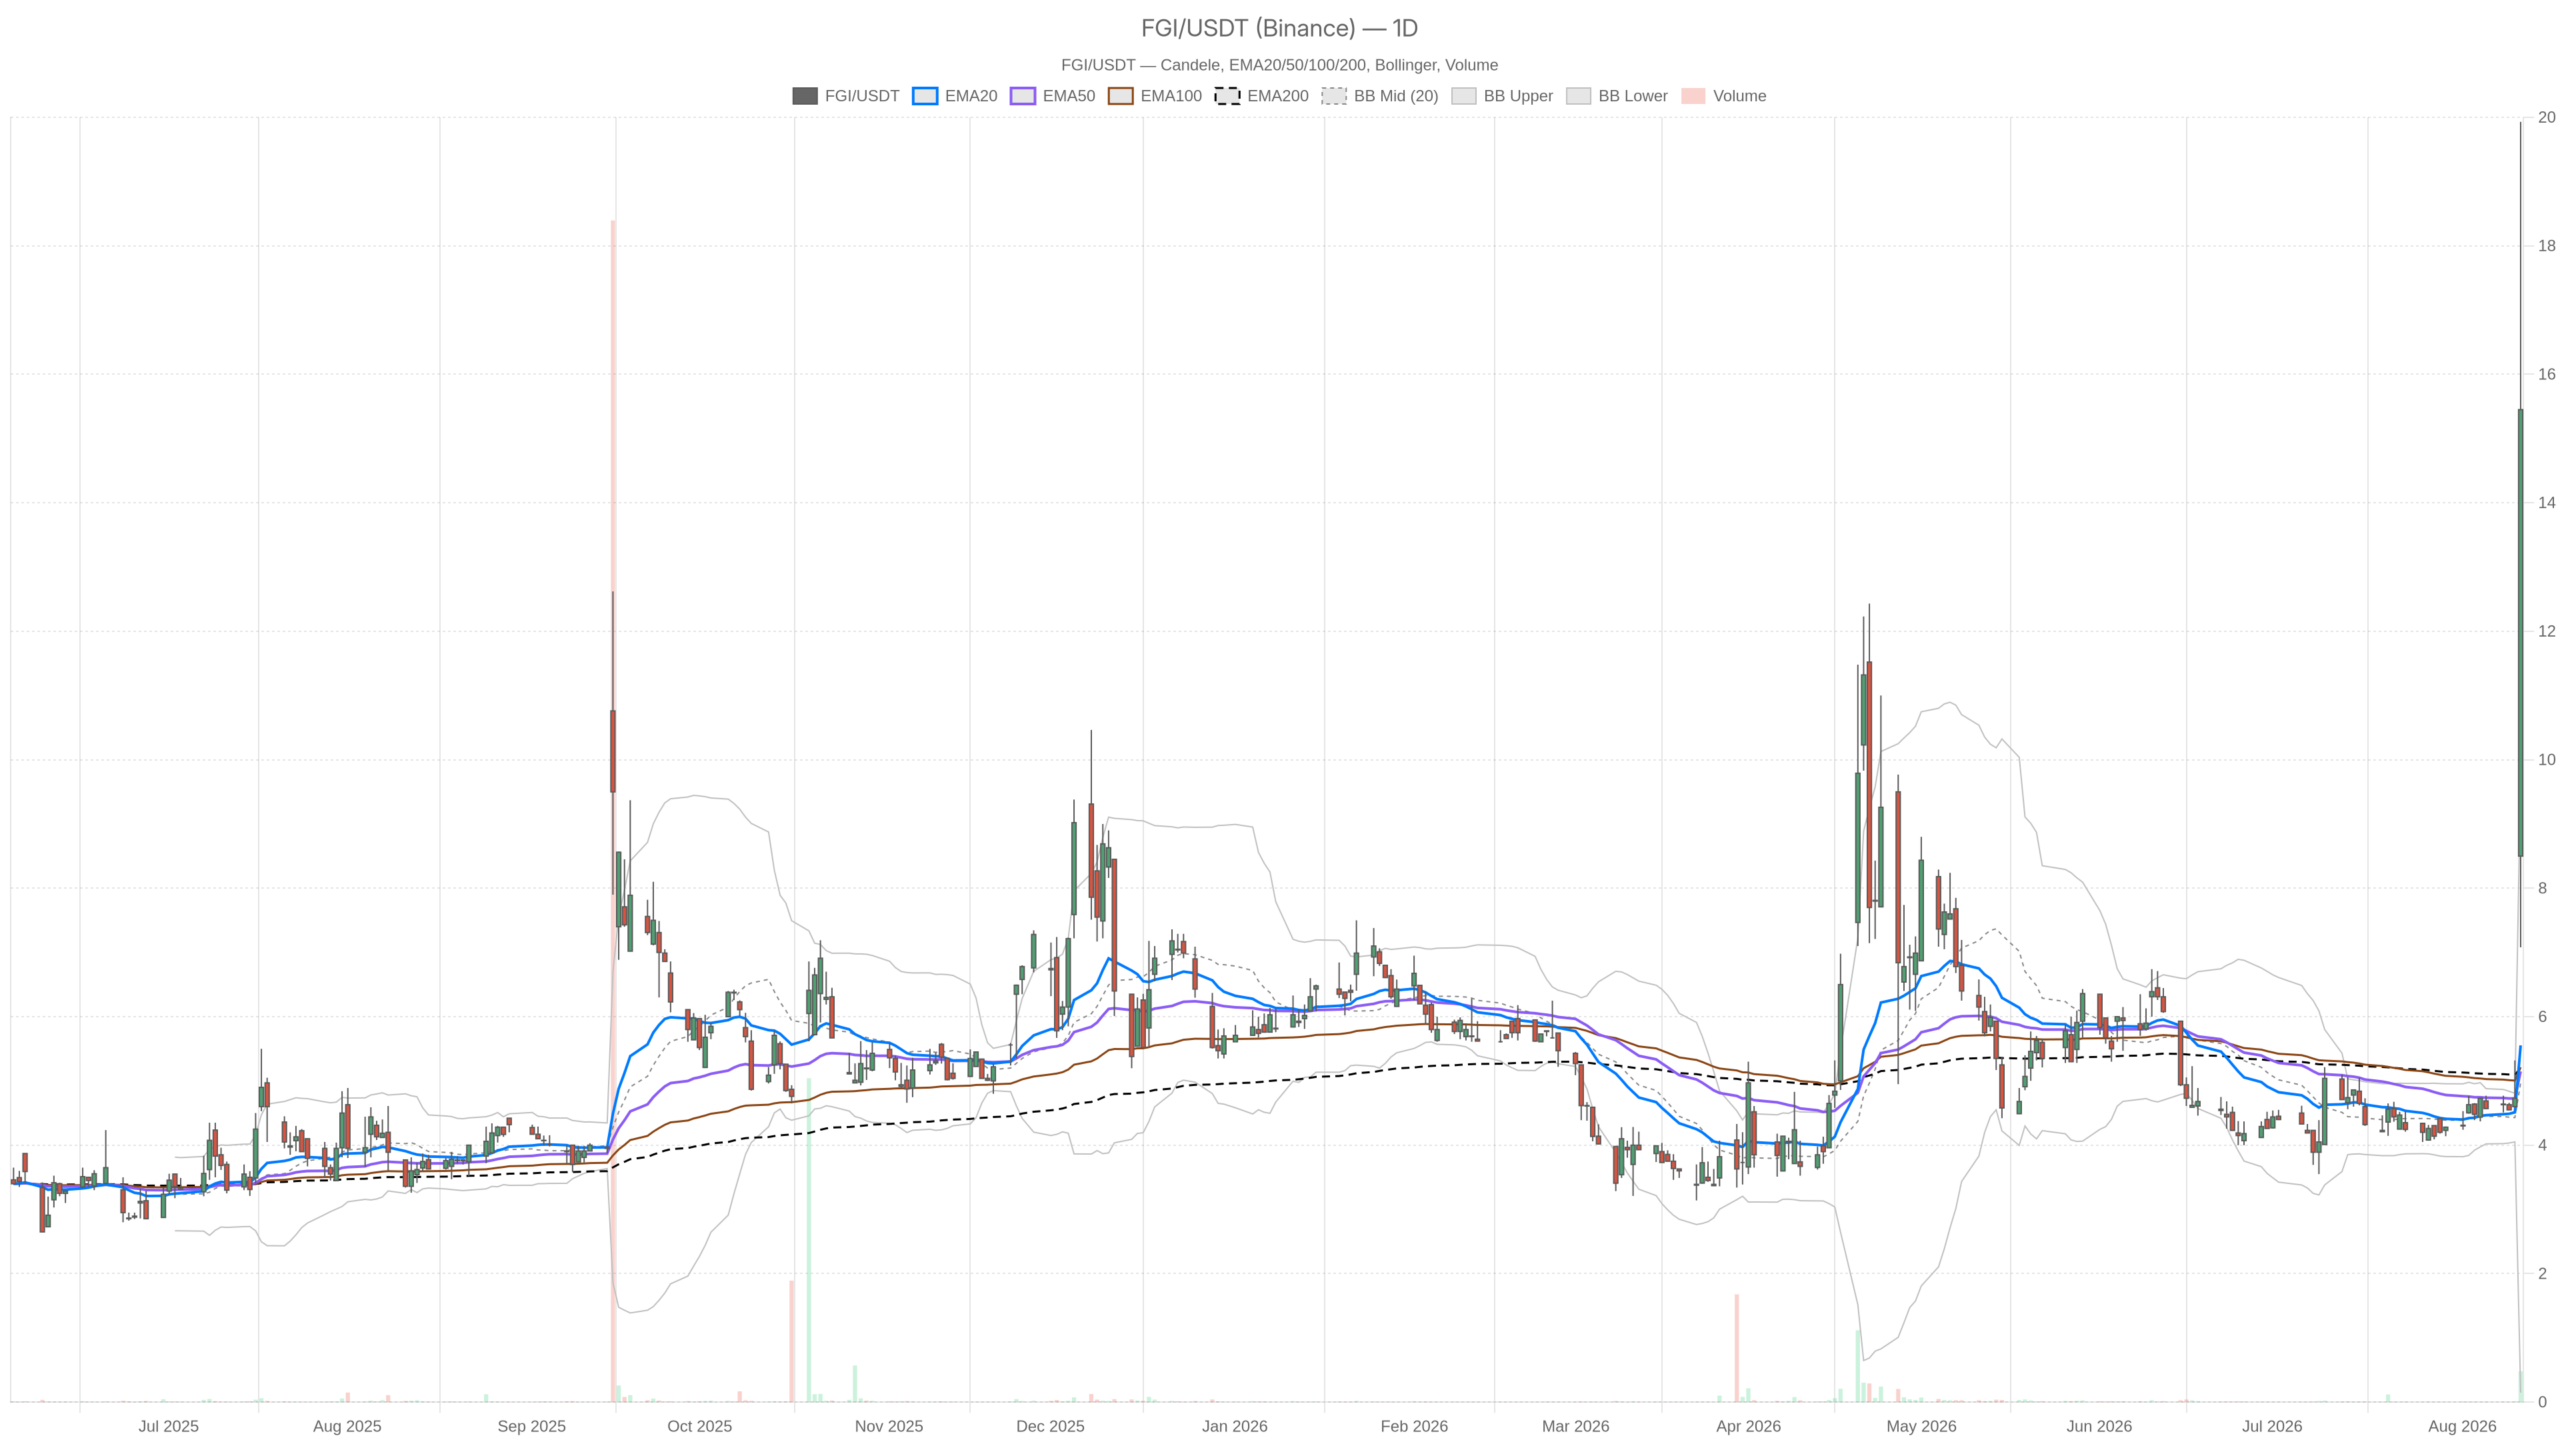 FGI — daily chart with candlesticks, EMA20/EMA50 and volume.
Key takeaways
- FGI Industries Ltd. stock delivered a +360.87% earnings surprise for Q2 2026.
- Intraday range spanned $7.08 to $19.93 on volume exceeding 1,082,406 shares.
- Daily RSI14 reached 92.31, an extreme overbought reading rarely sustained.
- Price closed nearly $6 above its daily Bollinger upper band at $9.79.
- Hourly EMA structure remains bullish with EMA20 above EMA50 above EMA200.
Daily Chart: FGI Industries Stock Tests Extreme Overbought Levels
Daily momentum indicators on FGI Industries Ltd. stock are among the most extreme a chart can produce. RSI14 sits at 92.31 and MACD is firmly bullish, confirming that upside momentum has built aggressively into this move.
Momentum and Trend Signals
On the daily timeframe, MACD shows the line at 0.87 versus a signal of 0.12, producing a histogram of 0.75. RSI at 92.31 signals an asset stretched far beyond any near-term equilibrium. However, the trend-following structure has not caught up. EMA20 at 5.55, EMA50 at 5.15, and EMA200 at 5.20 all sit clustered far below the current price of 15.45. That gap explains why the system still classifies the daily regime as neutral despite momentum extremes. In practice, the trend label is simply lagging reality.
Volatility Envelope Deviation
The Bollinger Bands reinforce the picture. The daily mid-band sits at 4.97, with the upper band at just 9.79. Price closing at 15.45 means FGI stock trades nearly six dollars above its own upper band. This unusually wide deviation typically precedes some form of mean-reversion, even within a broader uptrend. Meanwhile, ATR14 stands at just 1.36, a figure dwarfed by the actual daily range of nearly 13 points. That mismatch confirms this was a volatility shock, not a normal session.
Pivot Context
Pivot levels add useful context for positioning. The daily pivot point sits at 14.15, with resistance at 21.23 (R1) and support at 8.38 (S1). Closing above the pivot at 15.45 suggests buyers retained control into the close, even after the sharp pullback from the day’s high.
Hourly Timeframe Confirms Bullish Structure for FGI Stock
The hourly chart on FGI Industries Ltd. stock shows an explicitly bullish regime, supported by a textbook EMA stack. EMA20 at 7.66 sits above EMA50 at 5.92, which sits above EMA200 at 4.97.
RSI14 on the hourly chart reads 88.4, still extremely overbought though marginally less stretched than the daily figure. MACD confirms the bullish tone, with the line at 2.11 well above the signal at 0.88, producing a histogram of 1.23. Momentum on this timeframe remains strongly positive.
At the same time, the hourly candle reveals hesitation. Price opened at 16.39, spiked to 19.93, then fell to a low of 14.35 before closing at 15.45. That is a wide-ranging, indecisive bar following an extended move. Notably, it closed below the hourly pivot of 16.58. Support sits at 13.22 (S1), with resistance at 18.80 (R1). The fact that price trades beneath its own pivot, despite the bullish regime tag, suggests short-term sellers have started testing the rally’s strength.
Meanwhile, the hourly Bollinger Bands show price closing at 15.45 against an upper band of just 13.7. FGI remains extended above its own volatility envelope on this timeframe as well. Overall, the hourly picture confirms the bullish bias but adds a layer of complication: momentum is strong, yet price has already pulled back meaningfully from its intraday peak.
15-Minute Chart: Execution and Near-Term Consolidation
The 15-minute chart on FGI Industries Ltd. stock shows momentum cooling. RSI14 has eased to 69.36 and MACD histogram has narrowed, pointing to deceleration rather than fresh acceleration.
MACD remains bullish, with the line at 2.82 above the signal at 2.39, but the histogram has compressed to just 0.43. This narrowing points to decelerating momentum consistent with a pause after an aggressive spike. Price action is also far tighter on this timeframe. The 15-minute candle ranged between 14.86 and 15.91, closing at 15.45, essentially right on top of its own pivot point of 15.41.
Resistance sits close by at 15.96 (R1), with support at 14.90 (S1). This compression right at the pivot with narrow bands nearby typically reflects a market digesting a large move rather than committing to a new direction. Interestingly, the 15-minute Bollinger Bands actually contain the current price, with the upper band at 19.42. That contrasts sharply with the daily and hourly charts, where price sits above the band entirely. The discrepancy highlights just how extreme the higher-timeframe extension is relative to short-term structure.
Bullish Scenario for FGI Stock
The bullish case for FGI Industries Ltd. stock depends on holding above the hourly pivot near 16.58 and reclaiming the session high of 19.93. If buyers manage that, the path toward daily R1 resistance at 21.23 opens up. Strong MACD readings across all three timeframes support continuation. Meanwhile, the bullish EMA stack on the hourly chart reinforces that near-term structure remains constructive. A sustained close above the daily Bollinger upper band at 9.79, and eventually challenging fresh highs, would validate the earnings beat as a genuine re-rating rather than a one-day spike.
Bearish Scenario: What Would Invalidate the Rally
The bearish risk for FGI Industries Ltd. stock is substantial precisely because the move has been so rapid. RSI above 90 on the daily chart and near 88 on the hourly chart are rarely sustainable without some retracement.
A break below the hourly pivot of 16.58, followed by a decisive move under hourly S1 at 13.22, would signal fading momentum and dominant profit-taking. A deeper failure below the daily S1 at 8.38 would be a much more serious signal. That would effectively erase the bulk of the earnings-driven advance and suggest the initial reaction was overdone. Given that ATR14 at 1.36 is far smaller than the actual range traded, further outsized swings in either direction should be expected.
Closing Thoughts on Positioning and Volatility
Overall, FGI Industries Ltd. stock is caught between a powerful earnings catalyst and technical readings stretched to historic extremes. The daily and hourly charts confirm strong momentum, and the hourly timeframe shows an outright bullish regime. However, RSI levels above 88 across both timeframes leave little room for complacency. The sheer size of the intraday range underscores how unstable this environment currently is. Therefore, positioning around FGI stock right now demands respect for volatility on both sides. The earnings beat has clearly changed the narrative, but with price this extended above its own moving averages and Bollinger Bands, the next move could be just as sharp as the last one, in either direction.
FAQ
What drove FGI Industries Ltd. stock to surge?
FGI Industries Ltd. stock surged after the company reported a +360.87% earnings beat for Q2 2026, while revenue missed marginally by -0.36% versus expectations.
How overbought is FGI stock after the earnings spike?
Daily RSI14 reached 92.31 and hourly RSI14 hit 88.4. Both are extreme readings that historically precede some form of retracement or consolidation.
What are the key support and resistance levels for FGI Industries Ltd. stock?
Key resistance sits at the daily R1 of 21.23 and the session high of 19.93. Support levels include the hourly S1 at 13.22 and the daily S1 at 8.38.
Is the bullish trend sustainable on FGI stock?
The hourly EMA stack remains bullish with EMA20 above EMA50 above EMA200, supporting near-term structure. However, price closed nearly $6 above the daily Bollinger upper band and above all hourly bands, suggesting extreme extension that often leads to mean-reversion before any trend can resume.
Disclaimer: This article is for informational purposes only and does not constitute financial advice, an investment recommendation, or a solicitation to buy or sell any financial instrument or cryptocurrency. The analysis provided is not indicative of future results. Investing in crypto assets and financial markets carries a high risk of capital loss. Always do your own research (DYOR) and consult a qualified financial advisor before making any decision.
Article produced with the assistance of artificial intelligence and reviewed by the editorial team.





 English (US) ·