
 2 hours ago
13
2 hours ago
13

JD.com, Inc. stock is caught between strong earnings and weak price action. The company posted a 21% profit jump with expanding margins in Q2 2026. Yet shares fell sharply as a revenue decline overshadowed the beat. The charts confirm sellers are in control for now.
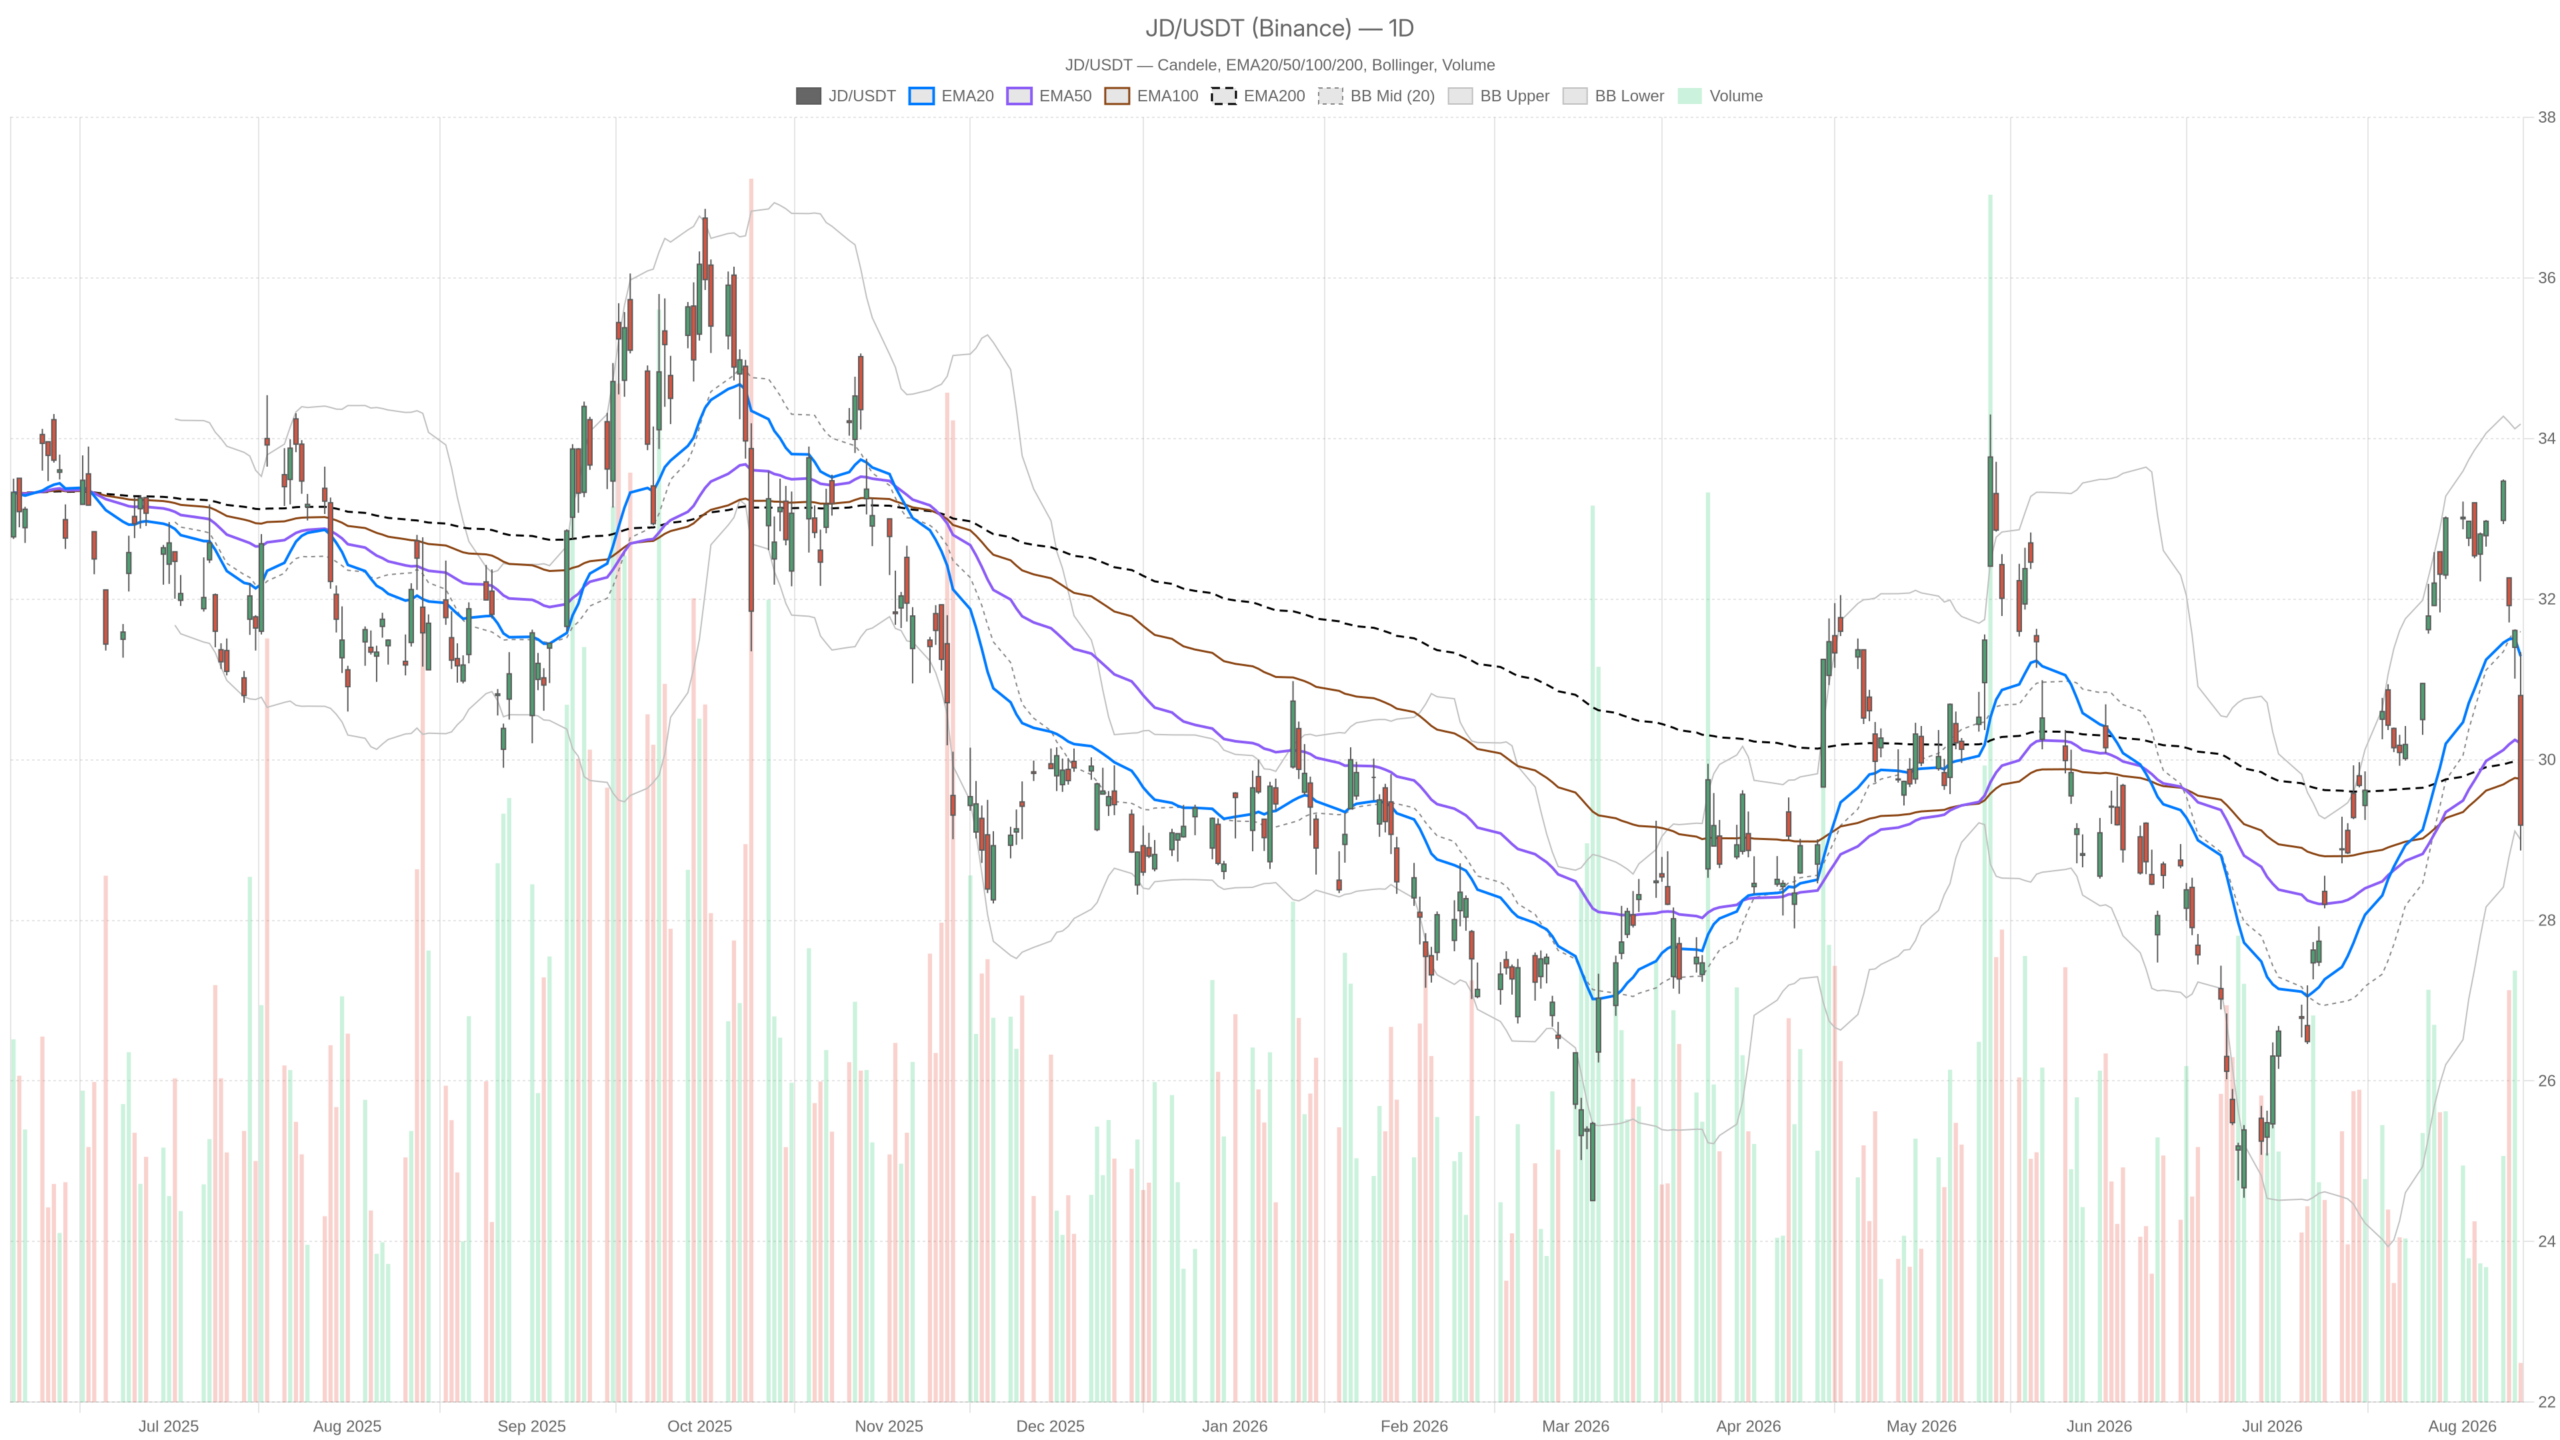 JD — daily chart with candlesticks, EMA20/EMA50 and volume.
Key takeaways
- JD.com posted a 21% profit increase and expanding margins in Q2 2026, but a revenue decline triggered sharp selling.
- JD stock closed at 29.18, below all three major daily moving averages (EMA20 at 31.29, EMA50 at 30.21, EMA200 at 29.97).
- Daily RSI14 sits at 38.46, not yet oversold, while hourly RSI14 has dropped to 20.56, signaling a stretched intraday sell-off.
- Key support rests at the daily S1 pivot of 28.26; a breakdown below this level would open the door to a deeper decline.
- The daily ATR14 of 0.90 confirms elevated volatility for a stock in the high-20s to low-30s range.
JD Stock Price Slips Below Its Moving Average Stack
JD stock price is now trading below its entire moving average stack, confirming a bearish daily alignment.
Moving Average Structure Turns Bearish
On the daily timeframe, JD closed at 29.18 after opening near 30.8 and printing a low of 28.87. That candle alone tells a story of aggressive intraday selling. Price now trades below the EMA20 at 31.29, the EMA50 at 30.21, and the EMA200 at 29.97. In short, all three averages sit above the current price. It is a textbook bearish alignment, even though the system still labels the daily regime as neutral given the tight EMA50/EMA200 cluster.
Momentum and Volatility Flash Caution
The daily RSI14 sits at 38.46, weak but not yet oversold. This leaves room for further downside. The MACD line at 0.70 remains above the signal line at 1.02 in absolute terms. However, the histogram at -0.32 shows momentum fading and rolling over. Bollinger Bands show price hugging the lower band. The mid-line sits at 31.59, the upper band at 34.18, and the lower band at 29. Closing at 29.18 puts JD on top of that lower band, signaling a market stretched to the downside.
Meanwhile, the daily ATR14 reading of 0.90 confirms that ranges have widened meaningfully. For a stock trading in the high-20s to low-30s range, that is a real move, not noise. Pivot levels reinforce the cautious tone. The daily pivot point sits at 29.8, with resistance at 30.73 and support at 28.26. JD currently trades below its pivot, squeezed between that pivot and the S1 support. This is the level bulls need to defend.
Hourly Timeframe Confirms the Bearish Tilt
The 1-hour chart not only confirms the daily weakness but intensifies it with an oversold RSI reading.
Intraday Trend Structure
On the H1 chart, EMA20 stands at 30.82, EMA50 at 31.66, and EMA200 at 30.75. Price at 29.18 trades beneath all three. This is a fully bearish moving average structure across the intraday trend.
Oversold Momentum on the Hourly Chart
Momentum on the hourly chart is where things get more extreme. RSI14 on H1 has dropped to 20.56. This is a genuinely oversold reading, suggesting the recent selling has been fast and forceful. MACD confirms the pressure. The line at -0.88 sits below the signal at -0.63, with a histogram of -0.26, both firmly negative. Bollinger Bands on H1 show a mid-line of 31.09, an upper band of 33.53, and a lower band of 28.65. Price sits once again near the lower boundary.
Notably, the hourly pivot cluster is extremely tight. The pivot point sits at 29.12, R1 at 29.27, and S1 at 29.04. JD is trading almost exactly at its intraday pivot after the sharp drop. This is where the conflict in signals becomes explicit. The daily trend is weak but not extreme. The hourly RSI, however, is deep into oversold territory. That combination often produces short-term relief bounces, even inside a larger bearish or neutral daily structure. In other words, the H1 timeframe confirms the bearish direction. Yet it also flags that the move may be stretched enough for a near-term pause or bounce.
15-Minute Execution Context
The 15-minute chart stays bearish but shows early signs of stabilization after the sell-off.
On the 15-minute chart, EMA20 at 29.54, EMA50 at 30.44, and EMA200 at 31.8 remain in a fully bearish stack above current price. RSI14 at 29.45 is soft and near oversold, consistent with the broader downside pressure.
However, the MACD histogram has ticked up to 0.04. This is a very small but notable shift after a stretch of negative readings. It hints at fading downside momentum on the smallest timeframe. The system explicitly tags the 15m regime as bearish, which aligns with the higher timeframes. Still, the marginal MACD improvement is worth watching for short-term timing, not as a trend change.
The Bullish Scenario for JD.com Stock
The bullish case rests on fundamentals, with 21% profit growth and expanding margins representing real operational improvement.
For bulls, the case starts with the fundamentals. Profit growth of 21% and expanding margins are not small details. They represent real operational improvement. If JD stock price can stabilize above the daily S1 support at 28.26 and reclaim the pivot at 29.8, that would be an early sign that sellers are losing control.
A recovery back above the daily EMA20 at 31.29 would be a stronger confirmation. This would be especially true if the MACD histogram turns positive and RSI14 pushes back above 40-50. On the hourly chart, a bounce from the oversold RSI14 of 20.56 toward neutral would support a near-term relief move. This holds particularly if buyers can defend the tight 29.04 to 29.27 pivot band.
The Bearish Scenario for JD Stock
The bearish case is closely tied to the revenue concern, with a break below 28.26 opening the door to a deeper decline.
If the market continues to focus on the revenue decline rather than the profit beat, JD stock could break below the daily S1 support at 28.26. That would invalidate the bullish setup and open the door toward more aggressive testing of the lower Bollinger Band structure.
Meanwhile, a daily close below 28.26 with RSI14 continuing to sit under 40 would confirm the shift. Combined with the MACD histogram remaining negative, this would signal the neutral daily regime tipping into a clearer downtrend. Continued failure to reclaim the 29.8 pivot would also keep pressure on the stock. The hourly trend remains fully bearish across all three EMAs.
Closing Take on JD.com, Inc. Stock
JD.com, Inc. stock sits at a genuinely uncertain crossroads, caught between improving fundamentals and deteriorating short-term technicals.
The earnings print showed real profit and margin strength. Yet the market chose to punish the revenue decline instead. Technically, the daily trend is fragile but not fully broken. The hourly trend is bearish and oversold at the same time. The 15-minute chart shows tentative signs of stabilizing momentum. That combination argues for caution in either direction.
At the same time, volatility, as measured by the daily ATR14 of 0.90, is elevated. Price sits right on top of key support near 28.87 to 29. Until JD stock price clearly reclaims its daily pivot and EMA20, or instead breaks decisively below S1 support, the setup remains a tug-of-war. Improving fundamentals battle a deteriorating short-term technical structure.
FAQ
Why did JD.com stock fall despite beating earnings expectations?
JD.com posted a 21% profit increase and expanding margins in Q2 2026. However, the company also reported a revenue decline, which the market chose to focus on. This overshadowed the profit beat and triggered sharp intraday selling, pushing JD stock below key moving averages.
What are the key support levels for JD stock right now?
Key support sits at the daily S1 pivot of 28.26. A breakdown below this level would open the door to a deeper decline. On the upside, JD must reclaim the daily pivot at 29.8 and the EMA20 at 31.29 to signal a shift in momentum.
Is JD stock oversold after the recent sell-off?
On the daily timeframe, RSI14 at 38.46 is weak but not yet oversold. However, the hourly RSI14 has dropped to 20.56, which is a genuinely oversold reading. This suggests the intraday sell-off has been aggressive and a short-term relief bounce is possible.
Disclaimer: This article is for informational purposes only and does not constitute financial advice, an investment recommendation, or a solicitation to buy or sell any financial instrument or cryptocurrency. The analysis provided is not indicative of future results. Investing in crypto assets and financial markets carries a high risk of capital loss. Always do your own research (DYOR) and consult a qualified financial advisor before making any decision.
Article produced with the assistance of artificial intelligence and reviewed by the editorial team.






 English (US) ·