
 3 hours ago
12
3 hours ago
12

Hims & Hers Health, Inc. stock sits in tense equilibrium after a sharp intraday reversal on July 23. Closing at $33.36 — right at its pivot of $33.34 — HIMS faces a neutral technical regime. An FDA advisory committee meeting, insider share sales, and elevated volatility place the stock at a genuine crossroads.
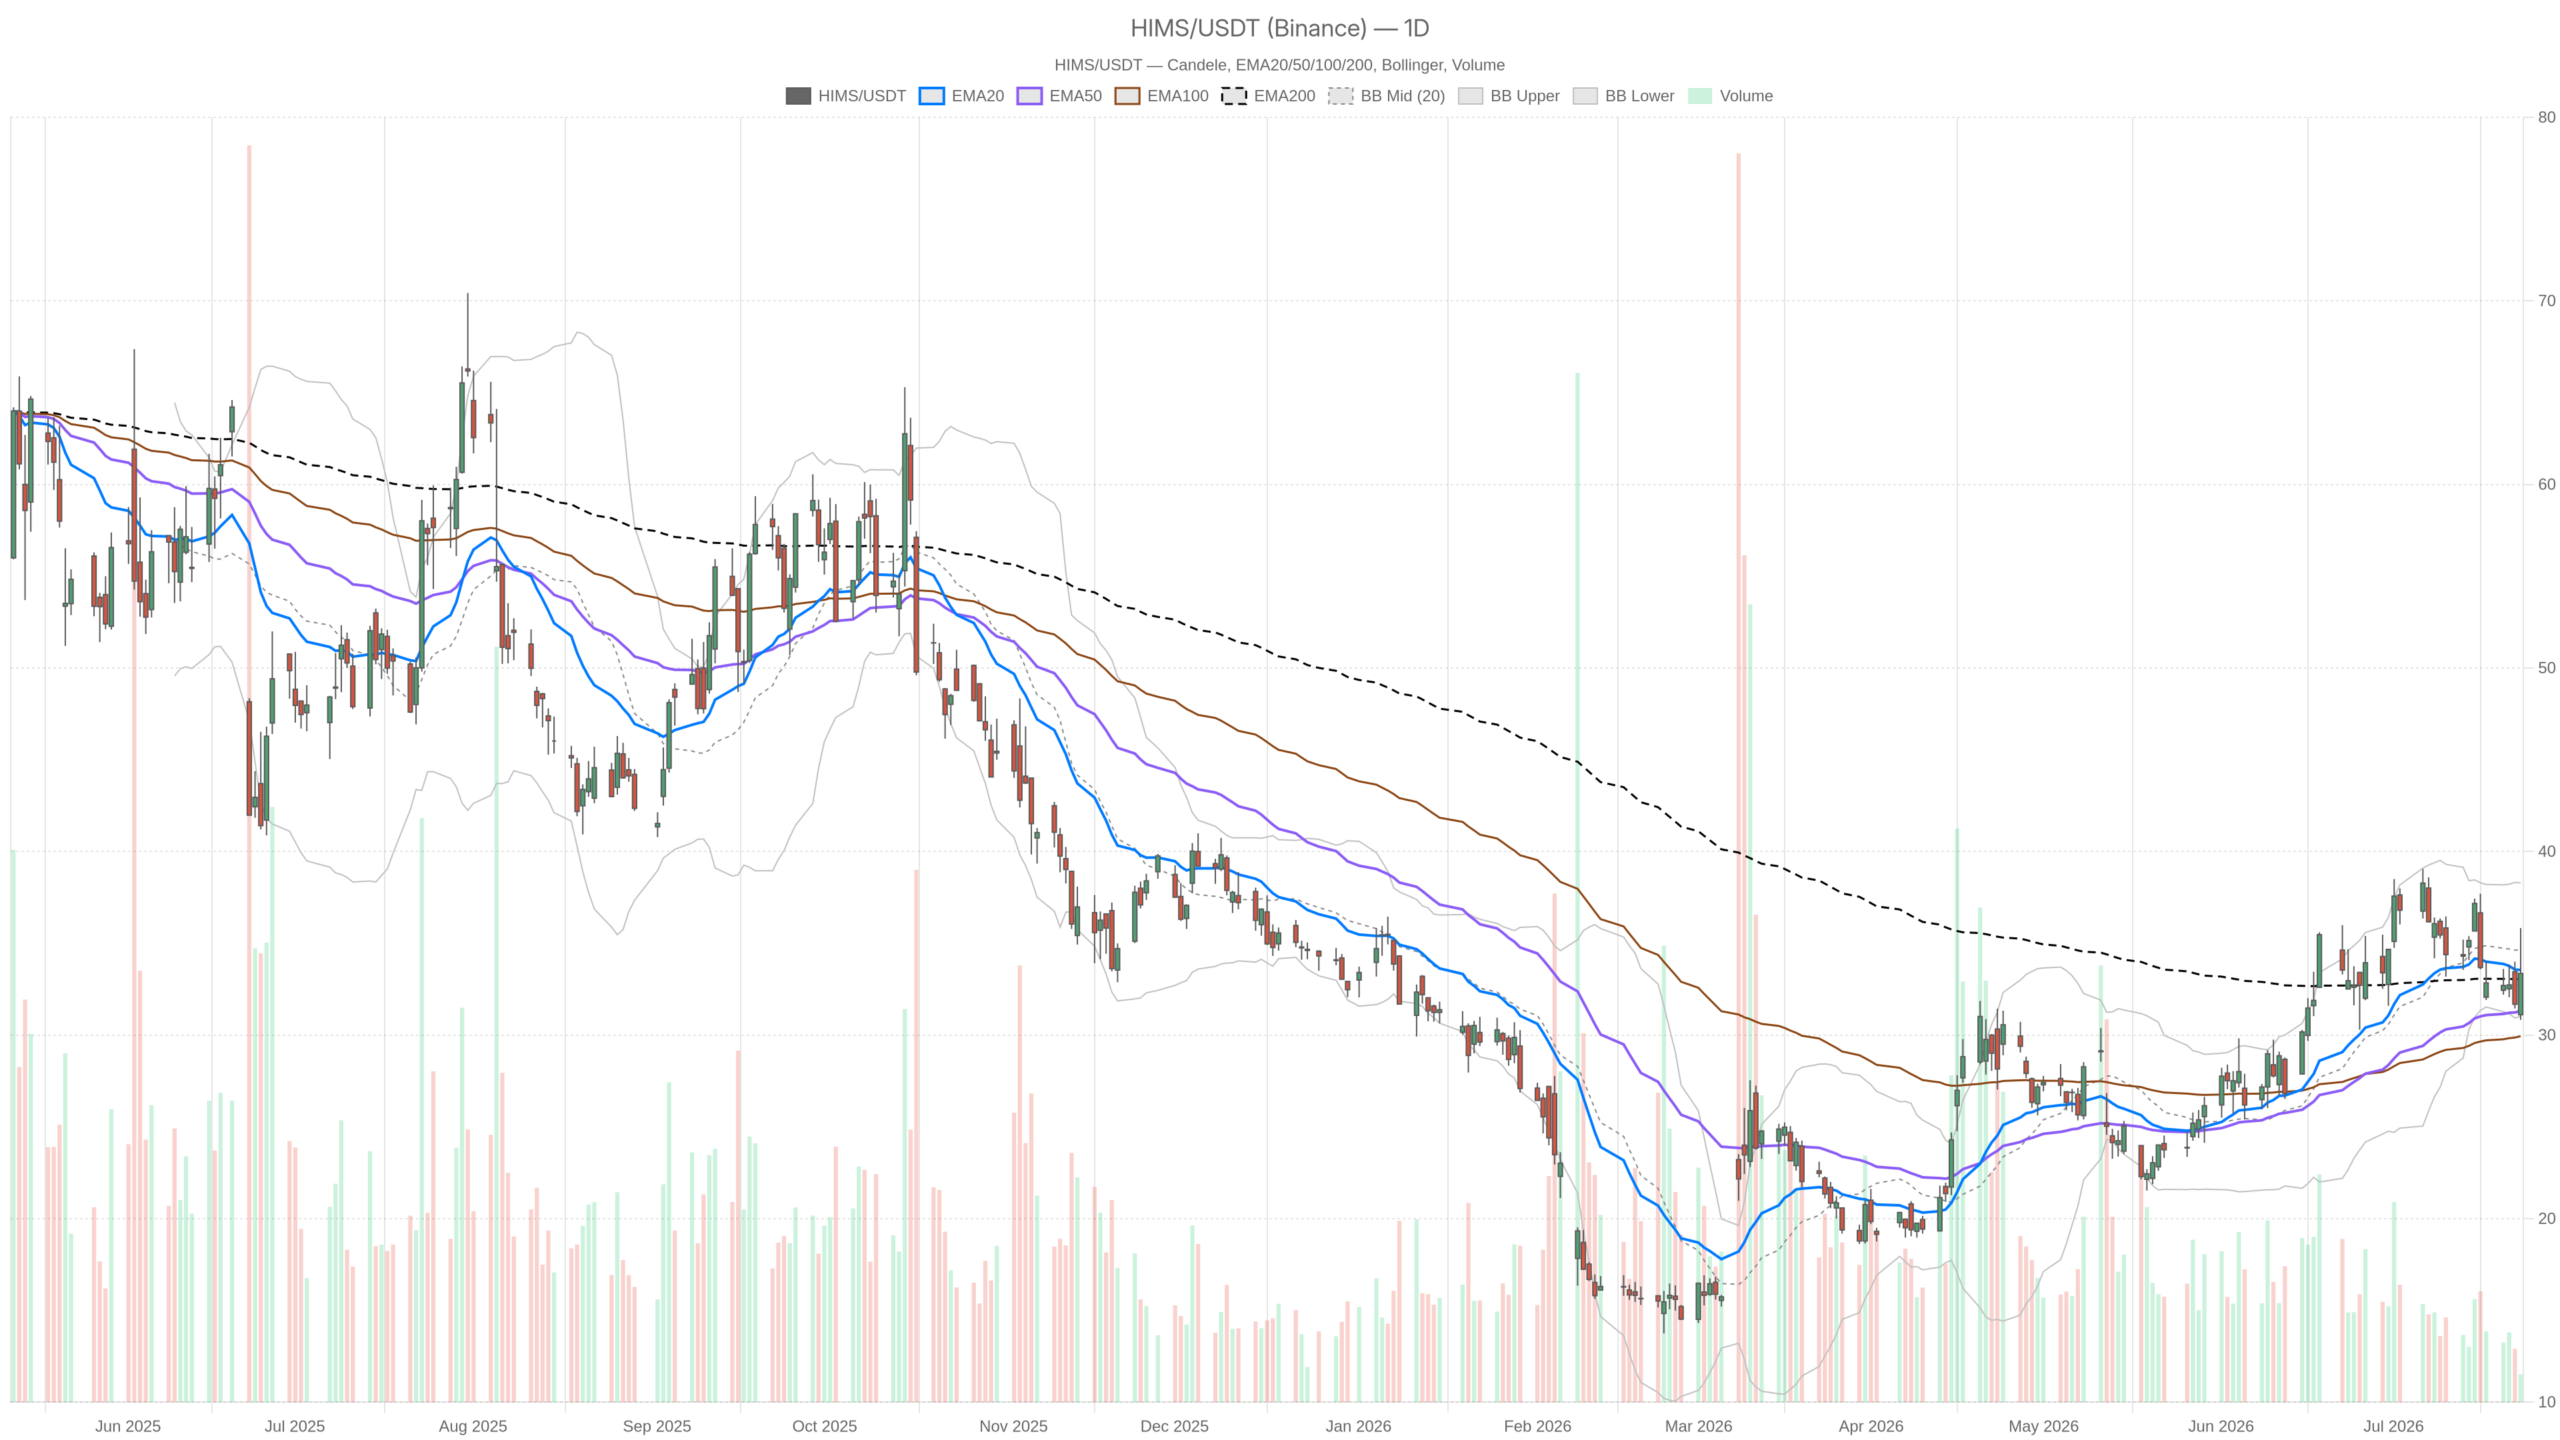 HIMS — daily chart with candlesticks, EMA20/EMA50 and volume.
Key takeaways
- HIMS closed at $33.36 on July 23, essentially flat against its pivot point of $33.34.
- The daily RSI at 50.95 signals perfect indecision, while the MACD histogram at -0.65 shows fading momentum.
- The FDA advisory committee meeting (July 23–24) on peptide compounding rules is the dominant near-term catalyst.
- A daily close above $34.66 (Bollinger midline) would signal a bullish reversal; a break below $30.85 would confirm bearish control.
- CFO share sale of approximately $229,000 and the chief accounting officer’s departure add governance-related uncertainty.
Daily Timeframe: Neutral Regime, But Structure Is Shifting
The daily chart shows HIMS in a neutral regime. Price is sandwiched between the EMA20 at $33.55 and EMA200 at $33.05. That compression rarely persists for long. The stock closed at $33.36 on July 23, essentially flat against its pivot point of $33.34. Meanwhile, the EMA50 sits further below at $31.31.
The RSI at 50.95 is a near-perfect reading of indecision. It neither confirms bullish momentum nor signals distribution. Meanwhile, the MACD tells a slightly more cautious story. The MACD line at 0.52 remains above zero. However, the signal line at 1.18 is higher, producing a histogram of -0.65. That negative histogram indicates fading momentum, even if the line has not yet crossed into bearish territory.
On the daily frame, Bollinger Bands place the midline at $34.66. The upper band sits at $38.29 and the lower at $31.02. Current price is below the midline — a subtle but meaningful detail. In a healthy uptrend, price typically holds above the midline. Here, it is struggling to reclaim it. The ATR of 2.43 reflects significant daily volatility, confirmed by the July 23 trading range of nearly five dollars.
Overall, the daily structure reads as a market in transition, not a market with conviction. The prior three-day losing streak closed at $31.68 on July 22. The sharp recovery on July 23 demonstrates just how reactive Hims & Hers Health, Inc. stock remains to headline risk.
Hourly View: Short-Term Momentum Quietly Rebuilding
The 1-hour chart offers a modestly constructive counterpoint to the daily indecision. Price at $33.36 sits above both the 1H EMA20 at $32.84 and the 1H EMA200 at $32.90. This is a short-term positive. The 1H EMA50 at $33.42 is the only resistance in the immediate vicinity. Price is essentially pressing against it.
Notably, the 1H MACD histogram is positive at 0.25. The MACD line itself, however, remains slightly negative at -0.07. This divergence between a negative line and a rising histogram is a classic early-recovery signal. It suggests the selling pressure that drove the prior slide may be exhausting. The 1H RSI at 52.6 corroborates this view. It is neither overbought nor oversold, but tilted fractionally to the upside.
In contrast, the 1H Bollinger midline at $32.62 is well below current price. This confirms the intraday bounce from the $30.83 low was substantial. The 1H pivot point sits at $33.43, with R1 at $33.53 and S1 at $33.25. Price holds above S1 but has not yet cleared R1. That narrow range reflects genuine uncertainty at the session level.
15-Minute Context: Execution Zone Near Pivot Resistance
The 15-minute chart places HIMS in a narrow execution zone. Support sits near $33.25 from the pivot S1. Layered resistance exists between $33.43 and $33.53. The EMA20 at $33.25 and EMA50 at $32.85 are both below current price. This supports the very short-term bid. However, the EMA200 at $33.44 sits just above the close of $33.36, acting as immediate micro-resistance.
Meanwhile, the MACD histogram at 0.03 is barely positive. Momentum has essentially flatlined at the short-term level. In short, the RSI of 53.33 tells the same story of contained, directionless energy. A clean break above $33.53 on volume would be the first meaningful short-term confirmation of bullish intent.
The FDA Catalyst: The Real Driver Behind the Volatility
The FDA advisory committee meeting on July 23–24 is the dominant catalyst driving HIMS’ recent volatility. Technical structure alone does not explain the $5 intraday range seen on July 23. The committee is examining whether seven peptides should be added to the Section 503A Bulks List. This regulatory outcome directly affects Hims & Hers’ compounding-related revenue streams.
In a notable development, the FDA has added eight new panelists described as “more qualified and less conflicted.” This development snapped HIMS’ three-day losing streak earlier in the week. On the other hand, the CFO’s sale of approximately $229,000 worth of shares ahead of this very meeting injected a credibility concern into the narrative. Furthermore, the departure of the chief accounting officer — who guided the company through its 2021 IPO — adds another layer of internal uncertainty.
Therefore, the technical neutrality across all three timeframes is not just a coincidence of indicator readings. It is a genuine reflection of a market that is waiting — and arguably anxious — for regulatory clarity.
Bullish Scenario: What Would Confirm an Upside Move
A bullish resolution requires a favorable FDA outcome and a daily close above the EMA20 at $33.55 and the Bollinger midline at $34.66. That would signal a regime shift from neutral toward bullish. The daily pivot R1 at $35.85 would then come into focus as the first meaningful upside target. The upper Bollinger band at $38.29 represents the outer boundary of a breakout scenario.
On the hourly chart, a sustained hold above the EMA50 at $33.42 would be the first confirming step. A MACD line crossing back above zero would further validate that short-term momentum is aligned with a potential daily trend recovery.
Bearish Scenario: What Would Invalidate the Bullish Case
An adverse FDA ruling — or even an ambiguous one — could send HIMS back toward key supports. The daily pivot S1 at $30.85 and the Bollinger lower band at $31.02 converge to form a significant technical support zone. A break below them on elevated volume would be a bearish structural signal. It could retest the $30.83 session low printed on July 23.
Meanwhile, the pre-meeting insider activity also warrants attention. The CFO’s share liquidation is not necessarily a definitive bearish signal. However, combined with the accounting officer’s departure, it raises governance questions. These concerns could weigh on sentiment regardless of the regulatory outcome. The daily MACD histogram currently sits at -0.65 in negative territory. If it deepens further without a corresponding bounce in the MACD line, the momentum deterioration would become harder to dismiss.
Positioning Amid Uncertainty
Hims & Hers Health, Inc. stock enters the post-FDA period with its technical structure precisely balanced. It is neutral on every timeframe and straddling its own pivot point. The stock is caught between conflicting short-term momentum signals and a fading daily trend. The ATR of 2.43 on the daily chart means significant daily moves are not just possible but expected. Volatility is the dominant feature here, not direction.
In short, the stock is not clearly broken, nor is it clearly recovering. It is, in the most literal sense, waiting for a verdict — both from regulators and from its own chart. Until price definitively reclaims the $34.66 Bollinger midline on the daily frame, or breaks decisively below $30.85, the only honest assessment remains. That assessment is one of elevated uncertainty and event-driven risk.
FAQ
What is the current technical outlook for Hims & Hers Health, Inc. stock?
The technical outlook is neutral across all timeframes. HIMS closed at $33.36 on July 23, essentially flat against its pivot of $33.34. The daily RSI at 50.95 signals perfect indecision. The MACD histogram at -0.65 indicates fading momentum. Price is compressed between the EMA20 at $33.55 and the EMA200 at $33.05, a tight range that rarely persists for long.
What key price levels should traders watch for HIMS?
On the upside, a daily close above the EMA20 at $33.55 and the Bollinger midline at $34.66 would signal a bullish regime shift. The daily pivot R1 at $35.85 is the next key target. On the downside, the daily pivot S1 at $30.85 and the Bollinger lower band at $31.02 form a significant support zone. The $30.83 session low from July 23 is the critical bearish level to monitor.
What is driving the recent volatility in HIMS stock?
The FDA advisory committee meeting on July 23–24 is the dominant near-term catalyst. The committee is examining whether seven peptides should be added to the Section 503A Bulks List. This decision directly affects Hims & Hers’ compounding-related revenue streams. Additionally, a CFO share sale of approximately $229,000 and the departure of the chief accounting officer have added governance-related uncertainty.
What would confirm a bullish or bearish breakout in HIMS?
A bullish breakout requires a favorable FDA outcome and a daily close above the Bollinger midline at $34.66. This would bring the pivot R1 at $35.85 and the upper Bollinger band at $38.29 into focus. Conversely, an adverse FDA ruling that pushes price below the $30.85–$31.02 support zone would confirm a bearish breakdown. That scenario could lead to a retest of the $30.83 session low.
Disclaimer: This article is for informational purposes only and does not constitute financial advice, an investment recommendation, or a solicitation to buy or sell any financial instrument or cryptocurrency. The analysis provided is not indicative of future results. Investing in crypto assets and financial markets carries a high risk of capital loss. Always do your own research (DYOR) and consult a qualified financial advisor before making any decision.
Article produced with the assistance of artificial intelligence and reviewed by the editorial team.









 English (US) ·