BTC $75,880
 ETH $2,232
 MGLOEURO $111,813
 USDT $0.9991
 BNB $696.03
 XRP $1.19
 USDC $0.9996
 SOL $90.49
 TRX $0.3187
 FIGR_HELOC $1.03
Ethereum · News brief
Ethereum slips back to $2.24K after $2.45K rebound fails
ETH is testing Fibonacci support near $2,240 while analysts watch $2.1K and $2.8K as the levels that matter.
Key takeaways
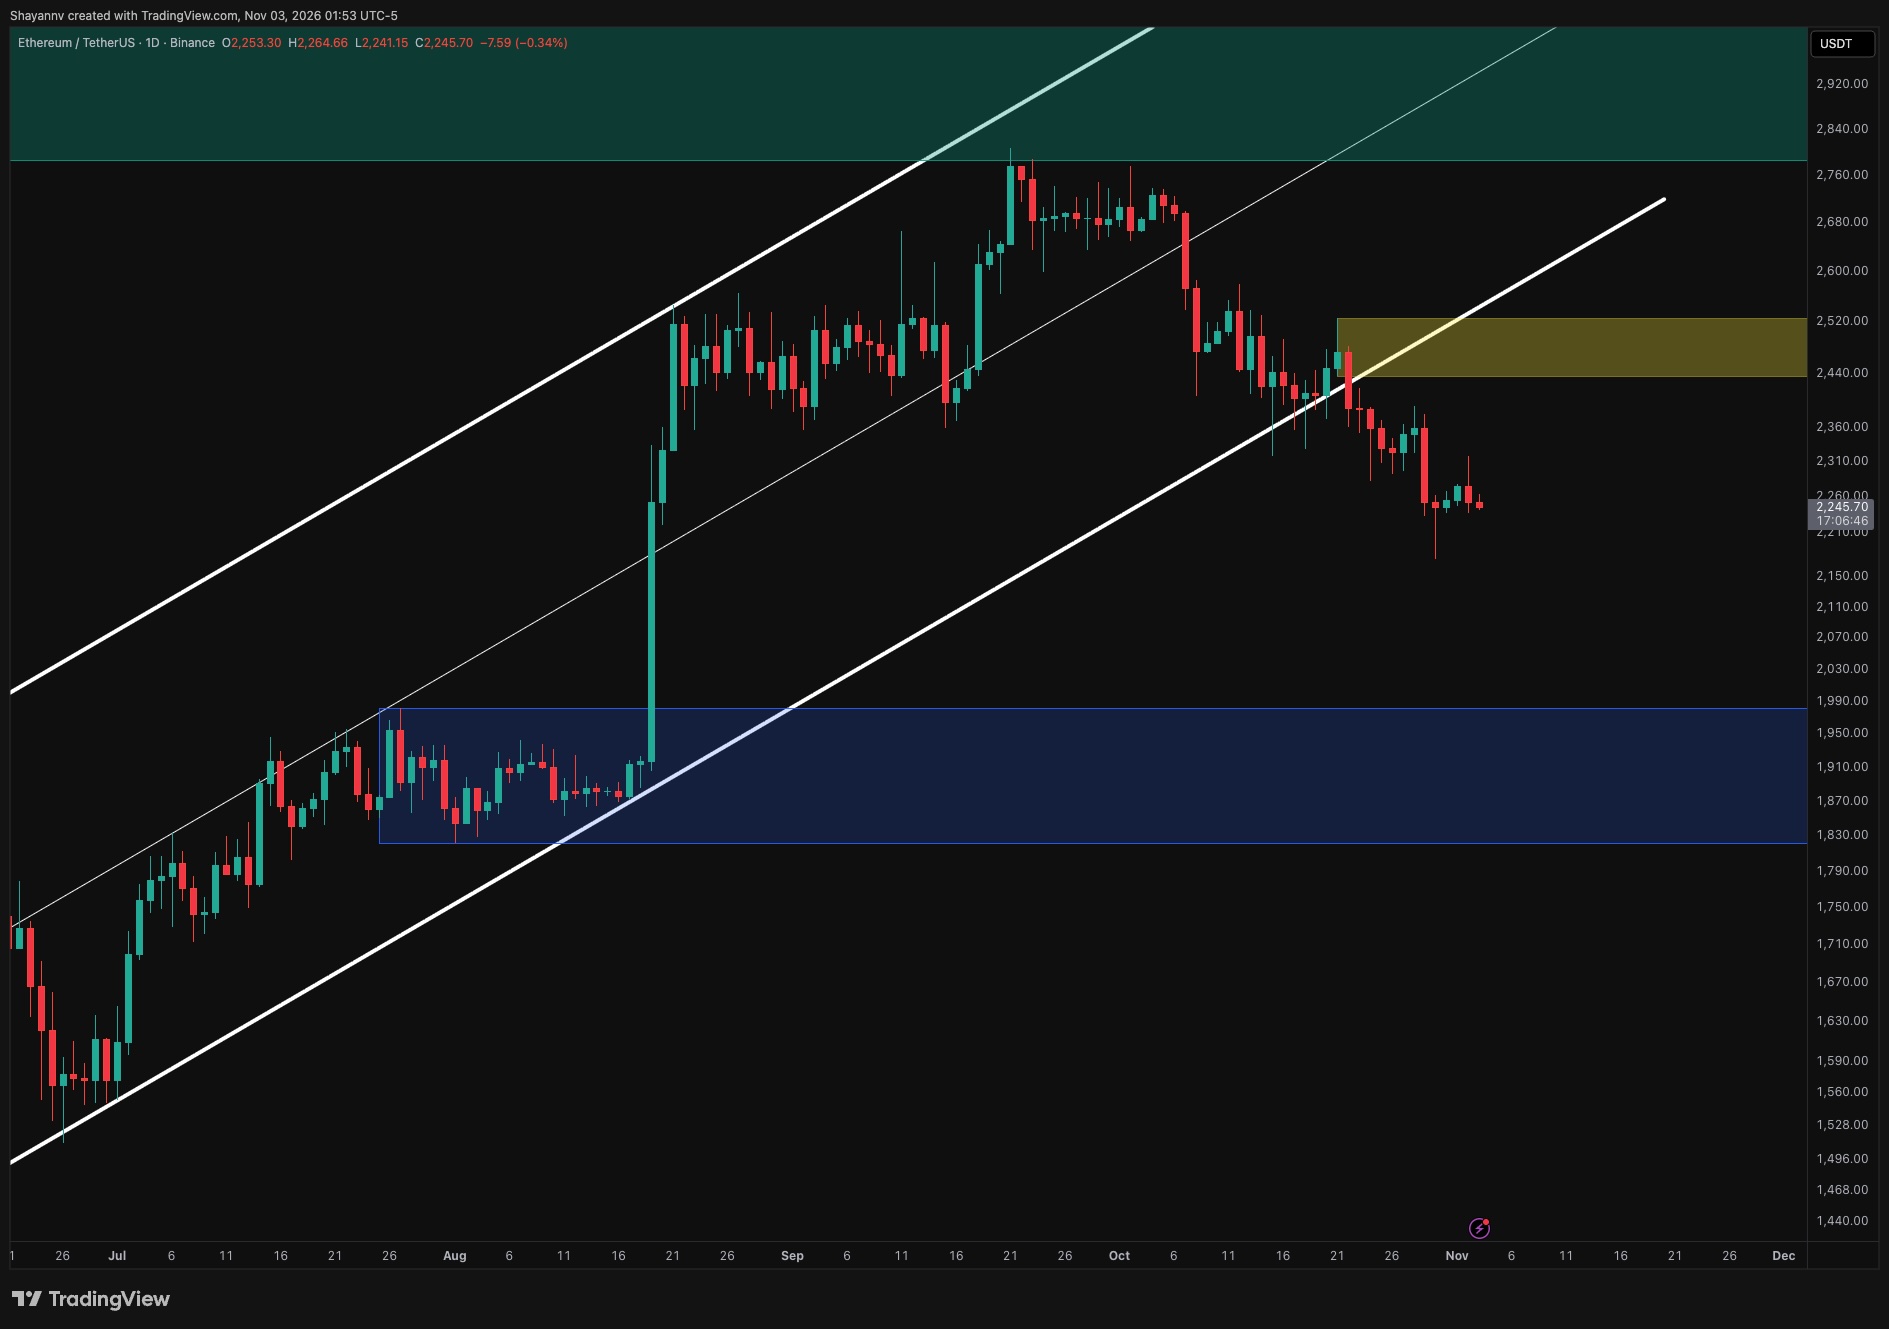
- Rejection at resistance. ETH stalled near $2,440, $2,500, the zone where a multi-month ascending channel broke down, and fell back toward $2,240.
- Levels in focus. Trader Daan Crypto Trades cites $2.1K and $2.8K as the higher-timeframe levels that matter; a daily close below $2.16K would expose $2K.
- Mixed momentum. The daily Awesome Oscillator remains below zero, while the weekly Supertrend near $2,008 still signals an uptrend.
What happened
Ethereum's latest attempt to recover lost ground ran into selling pressure, with the price retreating to roughly $2,244 on Nov. 5 after an advance toward the $2,440, $2,450 area was turned back, according to Crypto.news. The outlet reported that ETH was down 7.46% for the session and trading close to its intraday low of about $2,236.78.
The pullback returned the asset to a zone buyers had defended at the start of November, when ETH recovered above $2,250 and traded near $2,270. CryptoPotato reported that the rebound stalled inside the $2.5K region, described as the level where Ethereum's multi-month ascending channel had previously broken down, turning former support into resistance.
On the daily chart, Crypto.news noted that a Fibonacci retracement drawn across roughly $1,500, $4,950 places the 0.786 level near $2,240, right where price was sitting. CryptoPotato separately identified the 0.5 retracement of the June, September rally near $2.16K as the level that has contained the late-October dip.
The two reports describe a market caught between short-term improvement and an unresolved breakdown. CryptoPotato said the 4-hour chart shows a descending channel broken to the upside earlier in the week, but the breakout ran straight into the $2.5K supply zone and has since faded below $2.4K.
First $2.7KLatest $2.3K-16.5% over the period
Points are daily observations, not closing prices.