BTC $64,821
 EQQQQ $655.75 Last updated 8 Nov 2026, 12:03 UTC
 ETH $1,817
 MGLOEURO $111,813
 USDT $0.9992
 BNB $593.15
 USDC $0.9996
 XRP $0.9683
 SOL $73.31
 TRX $0.3055
Altcoins · Explained
XRP weekly RSI returns to 20 as price stays below $1
The weekly momentum gauge is testing 20 again while XRP trades near $0.95, with analysts watching for stabilization or further weakness.
Key takeaways
- Second test. XRP's weekly RSI returned to 20 shortly after a brief rebound, a faster second test than in earlier cycles, according to EGRAG Crypto.
- Key signal. A weekly close above 20 would be an early stabilization sign; repeated closes below it would keep the prior RSI low in play.
- Price check. Coinpedia says XRP still needs a five-step move higher, a resistance break and a Bitcoin recovery to support a sustained rebound.
What happened
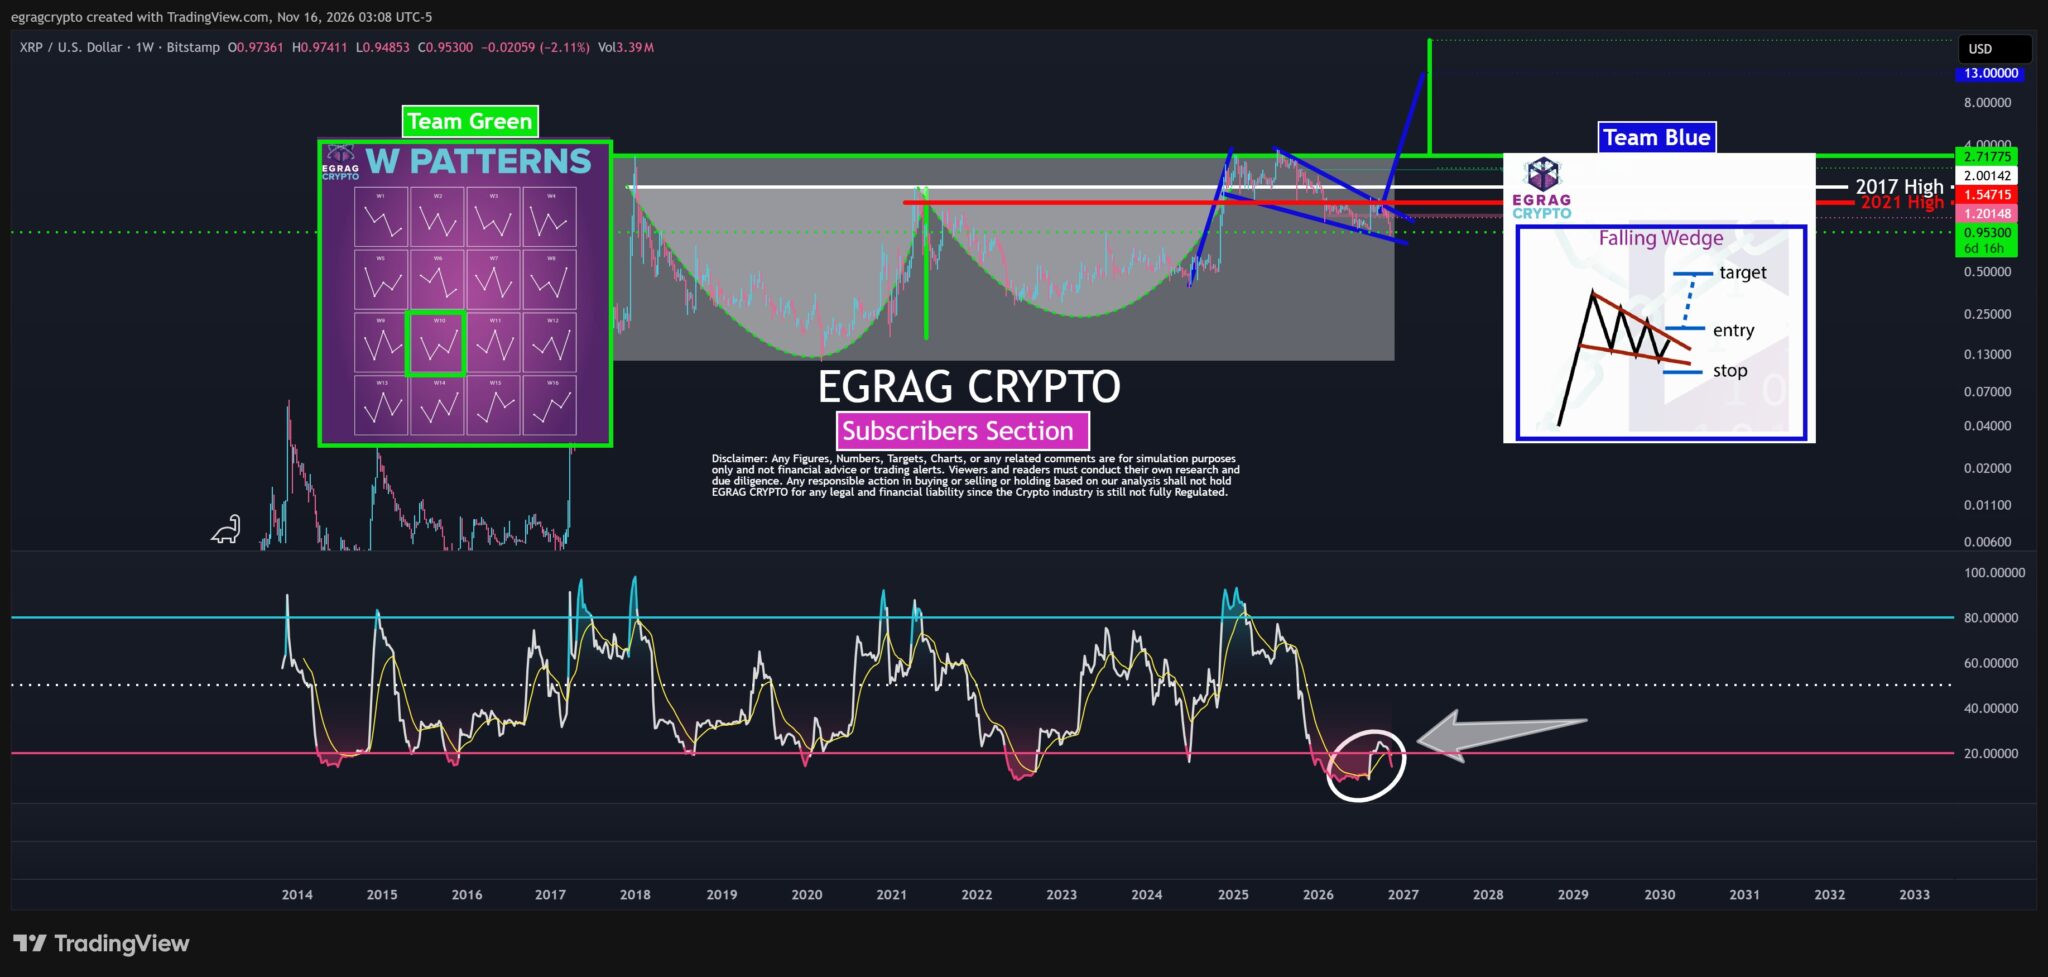
XRP's weekly relative strength index has moved back to the 20 area shortly after recovering from below that level, according to The Crypto Basic. The outlet reported that EGRAG Crypto drew attention to how quickly the second test arrived, with the token still trading below $1.
At 08:08 UTC on November 16, XRP changed hands at $0.9530 on Bitstamp, down 2.11% from the prior weekly close, The Crypto Basic reported. The new weekly candle had opened at $0.97361 and had traded between $0.94853 and $0.97411. Because more than six days remained in the week, both the price and the weekly RSI reading were provisional.
The Crypto Basic described the recent RSI path in three steps: a drop below 20 into the low teens, a recovery into the mid-20s, and a turn back toward 20. That brief rebound differs from the recovery after the 2022 trough, when the gauge moved away from 20 and eventually rose above 50.
Separately, Coinpedia reported that XRP had fallen below its August low while following Bitcoin lower. The outlet said a sustained recovery would require a clear five-step move higher, a break above nearby resistance and a supportive market backdrop, mainly a Bitcoin recovery, and that none of those conditions had been met.
First $1.30Latest $0.9591-26.2% over the period
Points are daily observations, not closing prices.
Why it matters
RSI compares the size of recent weekly gains with recent weekly losses on a zero-to-100 scale. Traders often treat 30 as the oversold threshold, while EGRAG's framework uses 20, a more extreme reading that requires losses to outweigh gains by a wider margin. The weekly close therefore matters because it could help distinguish a second momentum low from continued weakness, according to The Crypto Basic.
A second trough near 20 could form the right side of a W in momentum. A weekly close back above 20 would be an initial sign of stabilization, and a later push above the intervening peak in the mid-20s would give that view more weight. Conversely, repeated weekly closes below 20 would leave XRP vulnerable to another test of the earlier RSI low. Even so, a price bottom would need separate evidence, as with the earlier daily double-bottom setup near $1.
What the data shows
Coinpedia placed the first support zone between $0.795 and $0.86. Holding that area would keep the door open to a bounce, while a drop below $0.795 would raise the risk of a deeper decline toward $0.736 and possibly as low as $0.486. On the upside, Coinpedia said XRP must clear resistance between $0.981 and $1.19 to signal a larger rebound. Beyond that, it listed $1.34 and $1.66 as the next hurdles, with a stretch target of $2.80 still possible if the market turns.
The Crypto Basic's snapshot put XRP at $0.9530 on Bitstamp at 08:08 UTC on November 16, down 2.11% from the previous weekly close. The week had opened at $0.97361 and traded within a $0.94853 to $0.97411 range. The outlet noted that the weekly RSI reading remained provisional because the candle was still open.
Background
EGRAG's Team Green interpretation spans several years of XRP price history. It identifies two broad, rounded troughs forming a possible W beneath a horizontal boundary near $2.72. At $0.9530, XRP remained far below that line, so even a successful weekly RSI rebound would leave considerable distance before price could challenge it, The Crypto Basic reported.
Team Blue focuses on the decline from the 2025 highs. Two descending lines connect successively lower highs and lows and narrow into a possible falling wedge. Under that interpretation, the first price signal would be a break above the wedge's upper edge. The blue projection extends toward $13 only after an upside breakout; the RSI reading itself supplies no such target.
What to watch
For the nearer term, The Crypto Basic said two developments should be watched independently: whether weekly RSI can hold 20 and clear its recent rebound high, and whether XRP can break the sequence of lower price highs inside the wedge. The first would mark improving momentum; the second would give that improvement a visible counterpart in price.
Coinpedia's checklist remains separate from the RSI signal. It says XRP has not yet produced a clear five-step move higher, has not broken nearby resistance, and has not received support from a Bitcoin recovery. Those conditions are presented as requirements for a sustained recovery, not as forecasts.
Questions readers ask
What does an XRP weekly RSI of 20 mean?
It is a deeply oversold reading in EGRAG Crypto's framework. RSI measures recent weekly gains against recent weekly losses on a zero-to-100 scale; 30 is a common oversold threshold, while 20 is more extreme.
Why is a second RSI test near 20 notable?
The Crypto Basic reports that the rebound stalled quickly this time, unlike the recovery after the 2022 trough. EGRAG says a second trough could form the right side of a W in momentum.
What price levels does Coinpedia identify?
Support at $0.795 to $0.86, with a break below $0.795 risking $0.736 and possibly $0.486. Upside resistance is $0.981 to $1.19, followed by $1.34 and $1.66, with a stretch target of $2.80.