
 1 month ago
42
1 month ago
42
Intel stock is riding a powerful narrative wave. A prospective Apple foundry partnership, confirmed by President Trump, has pushed INTC shares up more than 7% in days. The daily chart supports a bullish regime — but fundamental cracks and short-term overextension deserve careful attention.
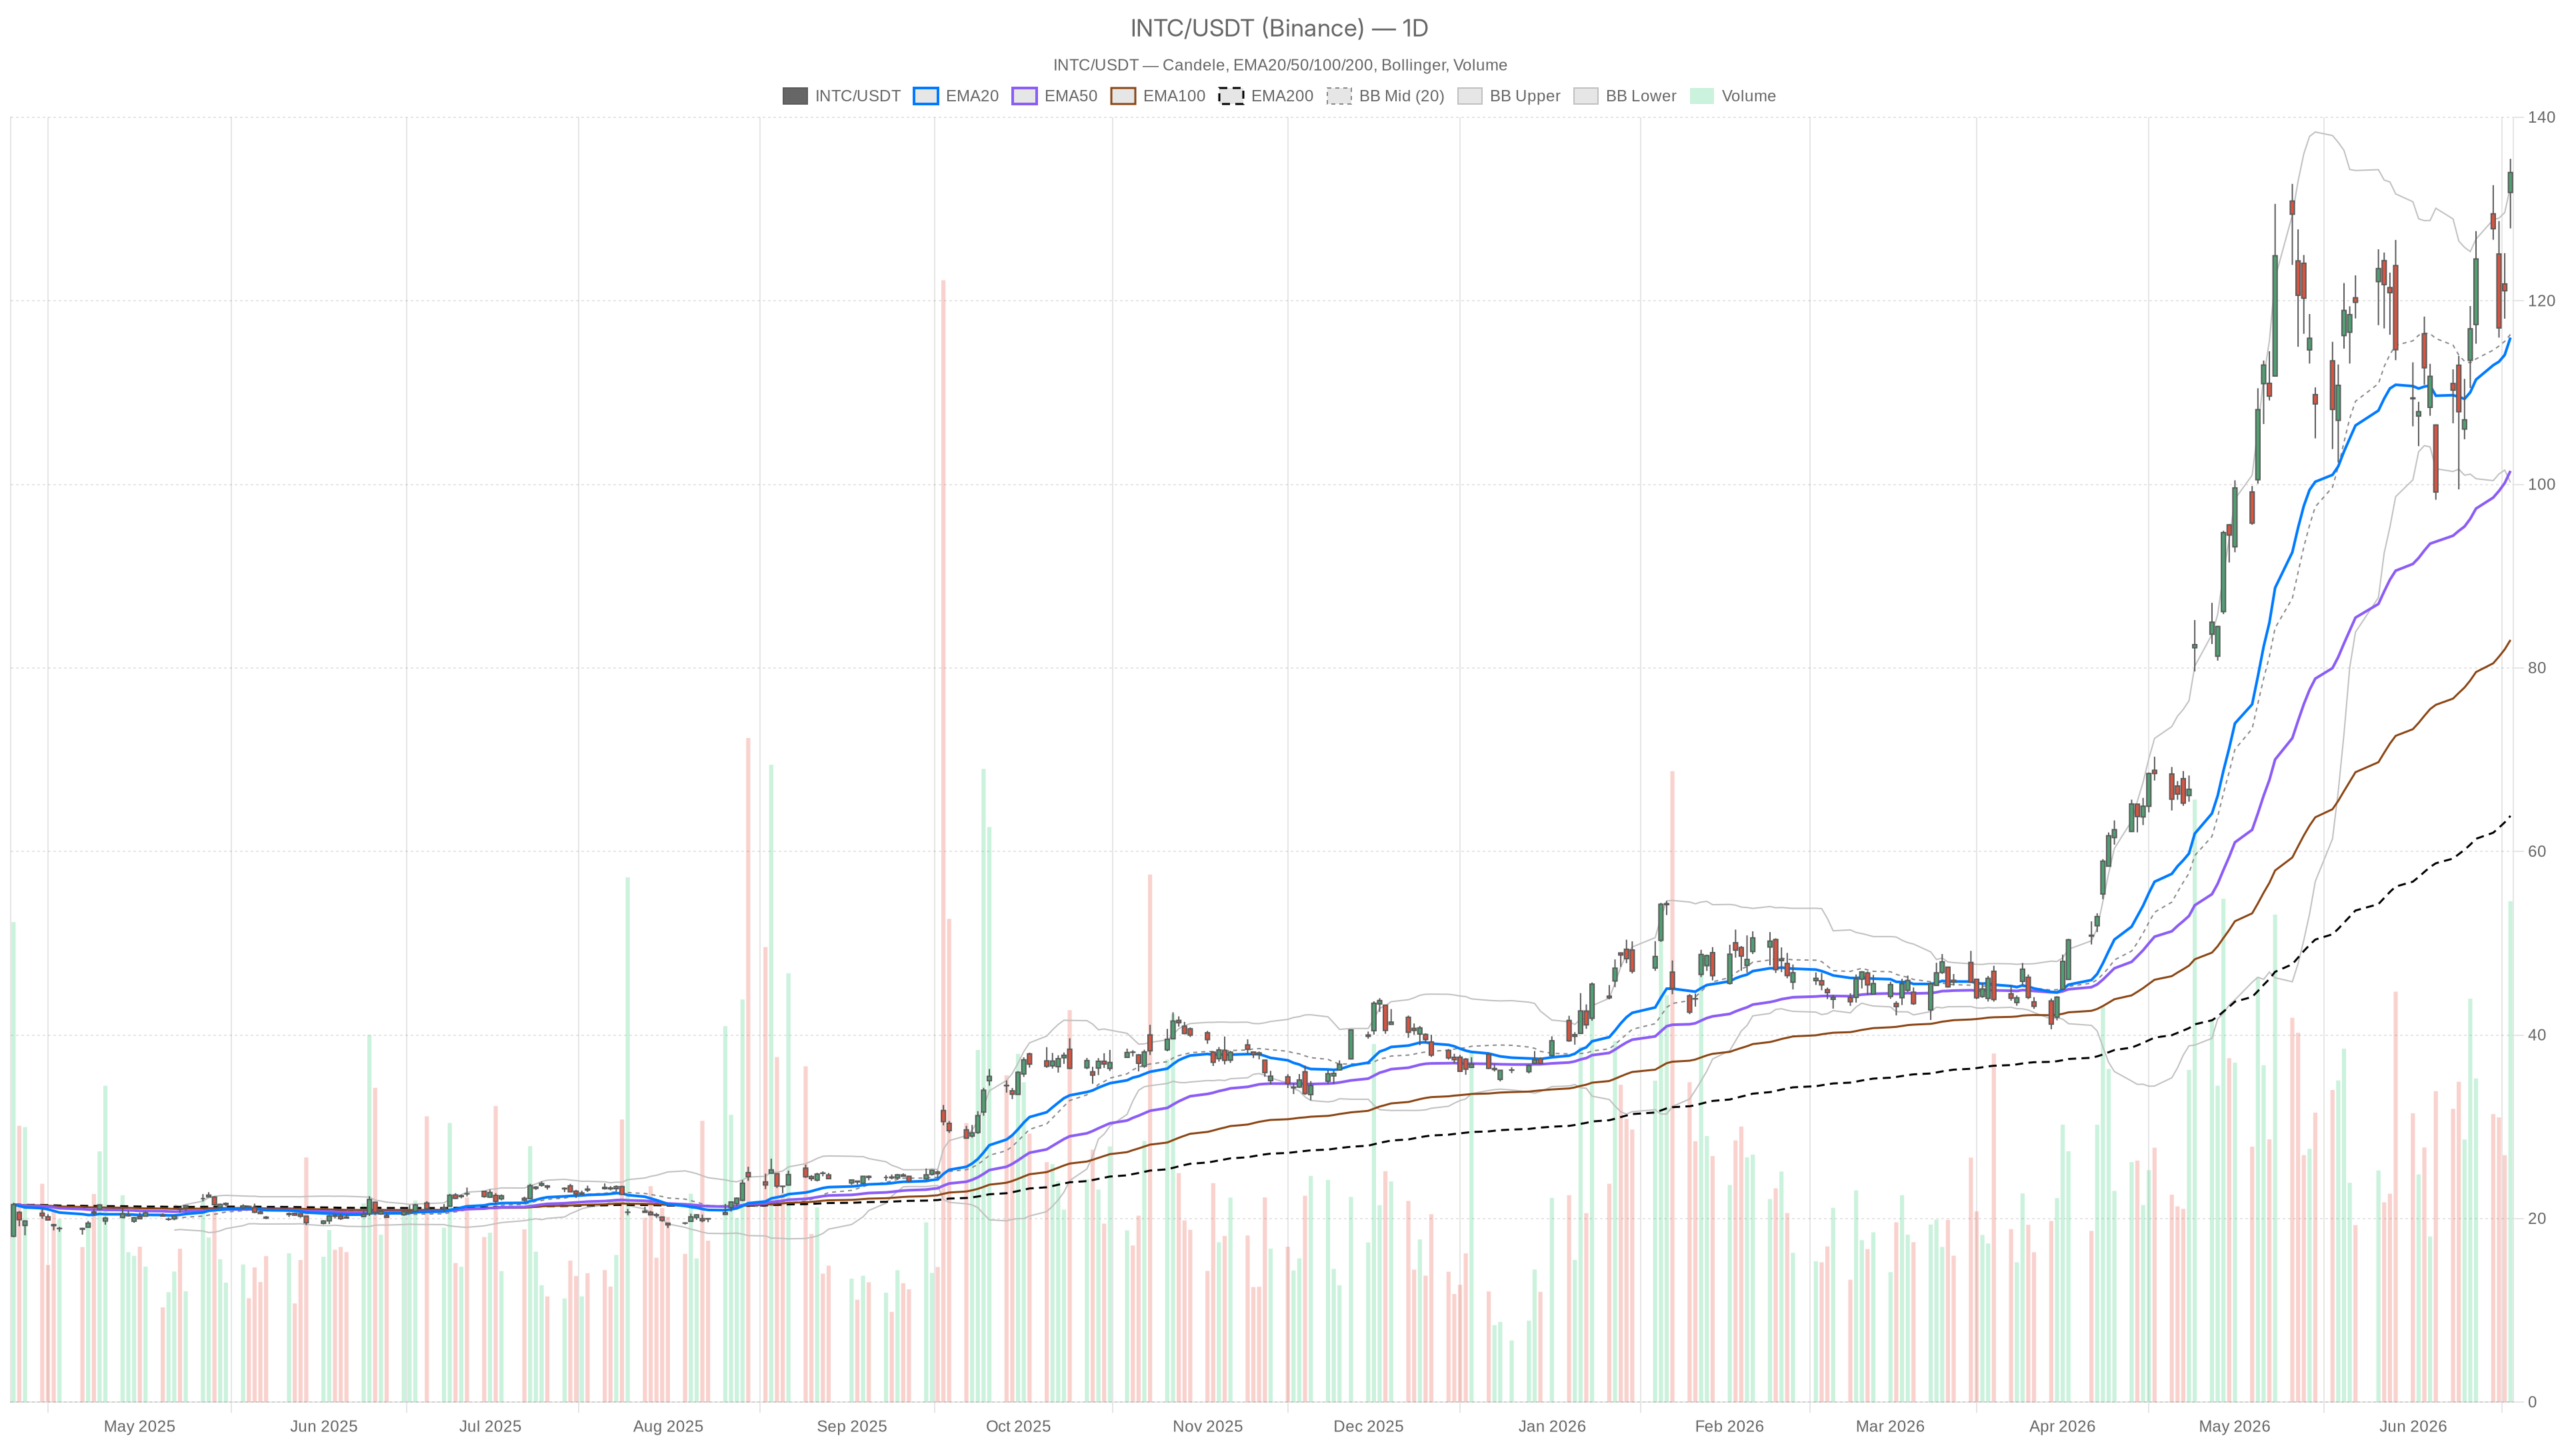 INTC — daily chart with candlesticks, EMA20/EMA50 and volume.
Key takeaways
- INTC closed at $133.99 on June 18, holding well above the EMA20 ($116), EMA50 ($101.47), and EMA200 ($63.88).
- Daily RSI at 64.21 confirms buying pressure without triggering overbought territory.
- The Apple-Intel foundry partnership is the dominant catalyst, but Intel’s fundamentals remain weak with ongoing server market share losses to AMD.
- A daily close below the S1 pivot at $129.43 would be the first meaningful technical warning.
- ATR14 at $10.39 signals that $10 intraday swings are now the baseline risk assumption for INTC.
Intel Stock Daily Chart: A Bullish Structure in Full Force
Intel stock’s daily chart is unambiguously strong, with price closing well above all major exponential moving averages on June 18. INTC ended the session at $133.99, comfortably above the EMA20 at $116, the EMA50 at $101.47, and the EMA200 at $63.88. That ascending EMA stacking is one of the clearest technical signatures of a trend in full force. However, price is running nearly $18 above its 20-day average — a gap that reflects momentum, but also stretched positioning.
Momentum Indicators Confirm Strength Without Overheating
The daily RSI at 64.21 confirms buying pressure without yet triggering a textbook overbought reading. Meanwhile, the MACD histogram remains positive at 0.68, with the MACD line at 5.91 holding above its signal at 5.23. Momentum has not rolled over. Still, the histogram’s relatively modest expansion suggests the pace of acceleration is slowing, even if the trend itself remains intact.
Elevated Volatility Defines the New Trading Environment
Bollinger Band placement adds important context for Intel stock. The upper band sits at $132.47 on the daily chart, and the June 18 close pushed through it. Sustained closes above the upper band are characteristic of strong trending environments. At the same time, they flag elevated volatility risk. The ATR14 at $10.39 quantifies this directly — intraday swings of that magnitude are now routine. Traders should treat that figure as a baseline risk assumption, not a tail-risk estimate.
Pivot Levels and Key Price Zones for Intel Stock
INTC is currently trading between its daily pivot at $132.46 and R1 resistance at $137.01, with S1 support at $129.43. The stock closed just above the pivot on June 18, keeping the near-term structure tilted bullish. A sustained hold above $132.46 keeps the trend valid. In contrast, a break below $129.43 would be the first meaningful technical warning for Intel stock.
Shorter Timeframes Confirm the Trend With Early Cautions
The 1-hour and 15-minute charts affirm Intel stock’s bullish bias, though early consolidation signals are emerging on the shortest timeframe. On the 1-hour chart, price sits above all three hourly EMAs — the EMA20 at $127.45, EMA50 at $122.28, and EMA200 at $112.54. All three remain aligned bullishly. The hourly MACD histogram is positive at 1.07, with the MACD line well above signal.
However, the hourly RSI reached 69.76 at the last read, pressing against overbought territory without quite clearing it. Intraday momentum still leans upward, but the reading warrants caution for traders chasing the move at current levels.
15-Minute Chart: Brief Digestion Within the Larger Trend
In contrast, the 15-minute chart introduces a small but real complication. The MACD histogram has flipped slightly negative at -0.38, with the MACD line at 1.84 crossing below its signal at 2.21. This is not a reversal signal — the 15-minute regime remains classified as bullish. However, it does suggest short-term selling pressure or consolidation after the recent push. The 15-minute RSI at 60.27 is benign, and price remains above the 15-minute EMA20 at $132.75. This timeframe is best read as a brief digestion phase within the larger uptrend.
Apple Partnership Narrative vs. Fundamental Reality
The Apple-Intel foundry partnership is real and meaningful, but the market is pricing in its potential rather than confirmed execution. Trump’s public confirmation of the deal triggered significant buying, and it represents a credible revenue opportunity for Intel’s struggling manufacturing division. If Apple were to shift even a portion of its chip production to Intel’s U.S. facilities, the business case for Intel’s foundry ambitions would be materially strengthened.
Yet the market is repricing Intel stock on the basis of that possibility, not its current reality. Intel continues to lose CPU server market share to AMD. Business fundamentals remain weak, with the company still unprofitable at the operating level. An analyst at D.A. Davidson publicly flagged the valuation contradiction — semiconductor ETFs are up more than 80% this year, and Intel’s multiple expansion has outpaced its earnings trajectory by a wide margin. Government-related support may provide a floor, but it is not the same as organic revenue growth.
Bullish and Bearish Scenarios for Intel Stock
Intel stock’s path forward hinges on whether the Apple partnership moves from announcement to execution, or whether weak fundamentals reassert control. The bullish scenario rests on the partnership evolving into meaningful manufacturing contracts. If Intel secures real chip volume from Apple — and if broader AI-related demand bolsters foundry utilization — the current price expansion could be justified over time. In that environment, INTC holding above daily pivot support near $129 and eventually testing R1 at $137 would be the natural progression. A broader semiconductor rally would reinforce that path.
On the other hand, the bearish case does not require a collapse. It simply requires the fundamentals to reassert themselves. If the Apple deal stalls, if AMD continues to eat into Intel’s server share, or if the market rotates toward profitability over AI narratives, the stock’s valuation premium becomes difficult to defend. A daily close below $129.43 would be the technical trigger to watch. From there, the EMA20 around $116 represents the next meaningful support level — a significant $17 below the current price.
Positioning Intel Stock in a High-Volatility Regime
INTC remains technically bullish across all three timeframes, but the risk/reward for new long positions has deteriorated compared to a week ago. The Apple-Intel narrative is the dominant near-term catalyst, and momentum remains constructive.
At the same time, with price extended above the daily upper Bollinger Band, hourly RSI approaching overbought, and a 15-minute MACD showing early consolidation signs, the short-term setup for fresh longs is less clean. Positioning here demands respect for the ATR. $10 daily swings are not anomalies — they are the new baseline. Volatility is elevated, the narrative is powerful, and the gap between price and fundamentals is wide enough to keep uncertainty firmly in the picture.
FAQ
Is Intel stock a buy right now?
Intel stock is in a technically bullish regime across all timeframes, but the price is extended above the daily upper Bollinger Band and the hourly RSI is near overbought territory. The risk/reward for fresh longs is less favorable than it was a week ago. Investors should weigh the powerful Apple partnership narrative against weak fundamentals before sizing any position.
What is driving the Intel stock rally?
The primary catalyst is a prospective foundry partnership with Apple, publicly confirmed by President Trump. This represents a meaningful potential revenue stream for Intel’s manufacturing division. Broader semiconductor sector strength and government-related support have also contributed to the stock’s upward momentum.
What are the key support levels for INTC?
The most immediate support is the S1 pivot at $129.43. A daily close below that level would be the first meaningful technical warning. Below that, the EMA20 around $116 represents the next significant support, approximately $17 below the current price. The daily pivot point at $132.46 is the near-term level bulls need to hold.
How significant is the Apple-Intel partnership?
The partnership could materially strengthen Intel’s foundry business if Apple shifts chip production to Intel’s U.S. facilities. However, the market is currently pricing in the possibility rather than confirmed revenue. Until the deal moves from announcement to execution with meaningful volume, the fundamental impact remains uncertain.
Disclaimer: This article is for informational purposes only and does not constitute financial advice, an investment recommendation, or a solicitation to buy or sell any financial instrument or cryptocurrency. The analysis provided is not indicative of future results. Investing in crypto assets and financial markets carries a high risk of capital loss. Always do your own research (DYOR) and consult a qualified financial advisor before making any decision.
Article produced with the assistance of artificial intelligence and reviewed by the editorial team.


 English (US) ·