
 3 months ago
47
3 months ago
47
- Litecoin has dropped over 55% from its 2025 highs and is testing major support near $53.
- Weekly and on-chain indicators remain bearish, with no clear confirmation of a reversal yet.
- A break above $66.56 could shift sentiment, but failure to hold support may expose LTC to sub-$45 levels.
Litecoin (LTC), like a lot of altcoins right now, is back in survival mode. There’s no clean way to say it. The coin has slid to levels not seen since October 2022, and the chart is starting to look uncomfortable again.
At the moment, LTC is hovering around $53, pressing into territory that previously marked the June 2022 cycle low. From its 2025 highs, Litecoin has lost more than 55% of its value. That’s not just a pullback, it’s a full reset driven by broader bearish conditions across crypto.
So the obvious question becomes: is this where Litecoin finds its footing, or is there still more pain ahead?
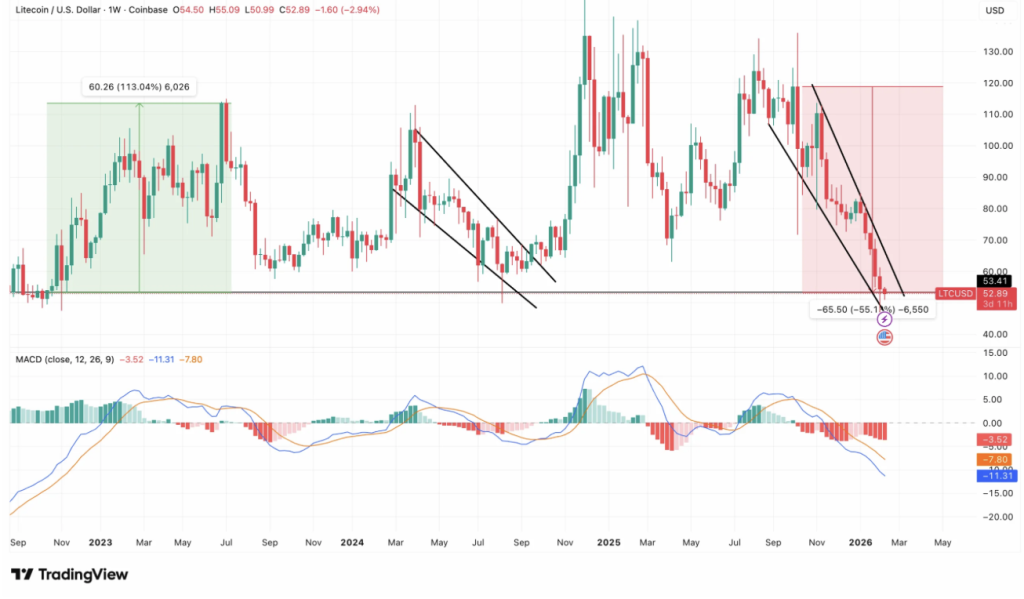
Weekly Chart Shows a Reversal Is Still Unconfirmed
On the weekly timeframe, Litecoin is firmly in a downtrend. The current price near $53 sits at a major horizontal level that once acted as strong support before the 2023 breakout. That’s a technically important zone.
But here’s the problem. When a structure like that gets lost, the narrative shifts. What looked like a corrective pullback can quickly become confirmed trend continuation. And right now, the market hasn’t shown enough strength to argue otherwise.
The MACD on the weekly chart is deeply negative, reflecting fresh bearish momentum. In previous cycles, when LTC’s weekly momentum rolled over like this, it tended to trend lower with conviction. There’s no clear bullish divergence yet. No sign of exhaustion. Just pressure.
For bulls to even start regaining control, Litecoin would need to reclaim the broken $70 region and invalidate the descending channel structure. That’s possible over time, but in the short term, it feels like a stretch.
At the moment, this looks more like a distribution-to-markdown transition, the kind you see in mid- to late-stage bear markets. If momentum doesn’t shift soon, this support revisit could flip from a recovery setup into a continuation signal.
On-Chain Data Paints a Similar Picture
From an on-chain perspective, the story doesn’t improve much. Litecoin’s MVRV Long/Short Difference is currently sitting around -20%. That means long-term holders are carrying heavier unrealized losses compared to short-term participants.
Historically, when this metric trends lower and stays suppressed, it reflects broad distribution rather than accumulation. Price is also printing fresh local lows near $53, reinforcing that the downtrend is being driven by sustained sell pressure.
What’s more concerning is that the MVRV hasn’t spiked into the kind of extreme territory you’d expect at a capitulation bottom. Instead, it’s grinding lower steadily. That kind of behavior suggests a prolonged bear phase rather than a dramatic washout and rebound.
In simple terms, Litecoin might need more time, and possibly lower prices, before a meaningful stabilization begins.
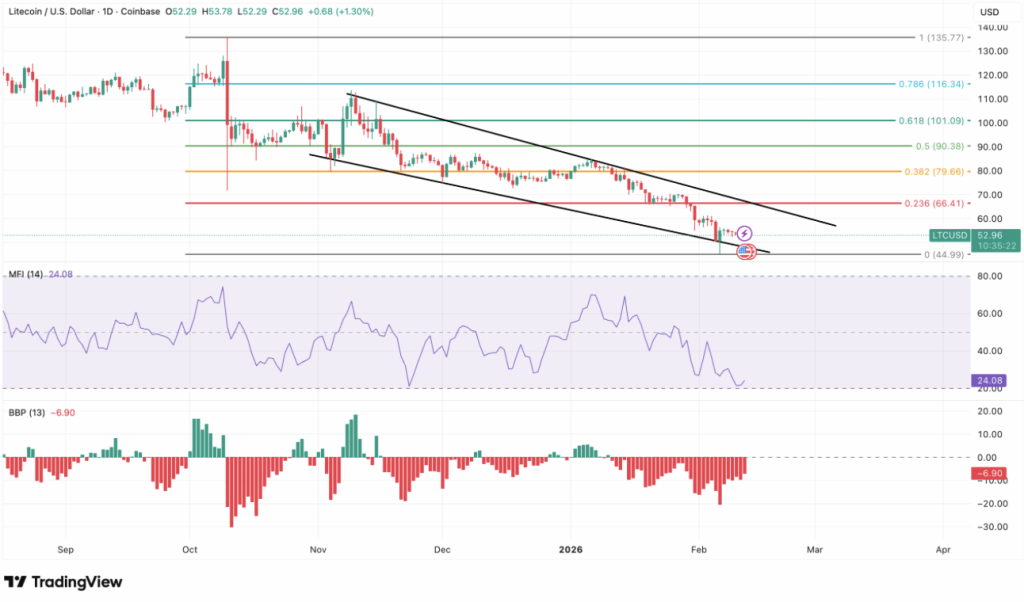
Daily Chart: Oversold, But Still Bearish
On the daily timeframe, LTC remains trapped inside a descending channel. Yes, there was a recent green candle, and yes, that hints at short-term buying interest. But one candle doesn’t break a trend.
The Money Flow Index (MFI) has dipped into oversold territory, which often signals that selling pressure is nearing exhaustion. That’s encouraging, at least in theory. The issue is that buyers haven’t stepped in aggressively yet. Oversold conditions can linger when fear dominates.
Meanwhile, the Bull Bear Power (BBP) indicator continues printing red histogram bars below zero, confirming that bears still control the tape. Momentum hasn’t flipped.
Technically, LTC is sitting at a support zone that has previously sparked upside reactions. But current market conditions feel fragile. Support alone doesn’t guarantee a bounce if macro pressure keeps building.
Key Levels to Watch for Litecoin
Right now, Litecoin is trading around $53.44. For sentiment to shift meaningfully, LTC needs to break above the $66.56 resistance level. Clearing that zone would signal that buyers are starting to regain control.
If that happens, the next upside targets could open toward $79 and potentially higher. But that scenario requires confirmation. Until then, any rally risks being capped or reversed within the existing bearish structure.
The bigger risk is macro continuation. If Bitcoin fails to stabilize and resumes its slide, Litecoin could briefly drop below $45 before finding a stronger base. That’s not guaranteed, but it’s within the realm of possibility given how correlated altcoins remain to BTC.
For now, Litecoin is sitting at a decision point. It’s oversold, structurally weak, and waiting for either momentum to flip… or for another leg down to finish the job.
Disclaimer: BlockNews provides independent reporting on crypto, blockchain, and digital finance. All content is for informational purposes only and does not constitute financial advice. Readers should do their own research before making investment decisions. Some articles may use AI tools to assist in drafting, but every piece is reviewed and edited by our editorial team of experienced crypto writers and analysts before publication.


 English (US) ·