
 2 hours ago
13
2 hours ago
13

McDonald’s Corporation stock trades in bearish territory on the daily chart, trapped below every major moving average. MCD closed at $264.76 on July 24, barely above its daily Bollinger Band lower boundary at $259.20. The recent 52-week low at $261.41 underscores persistent selling pressure.
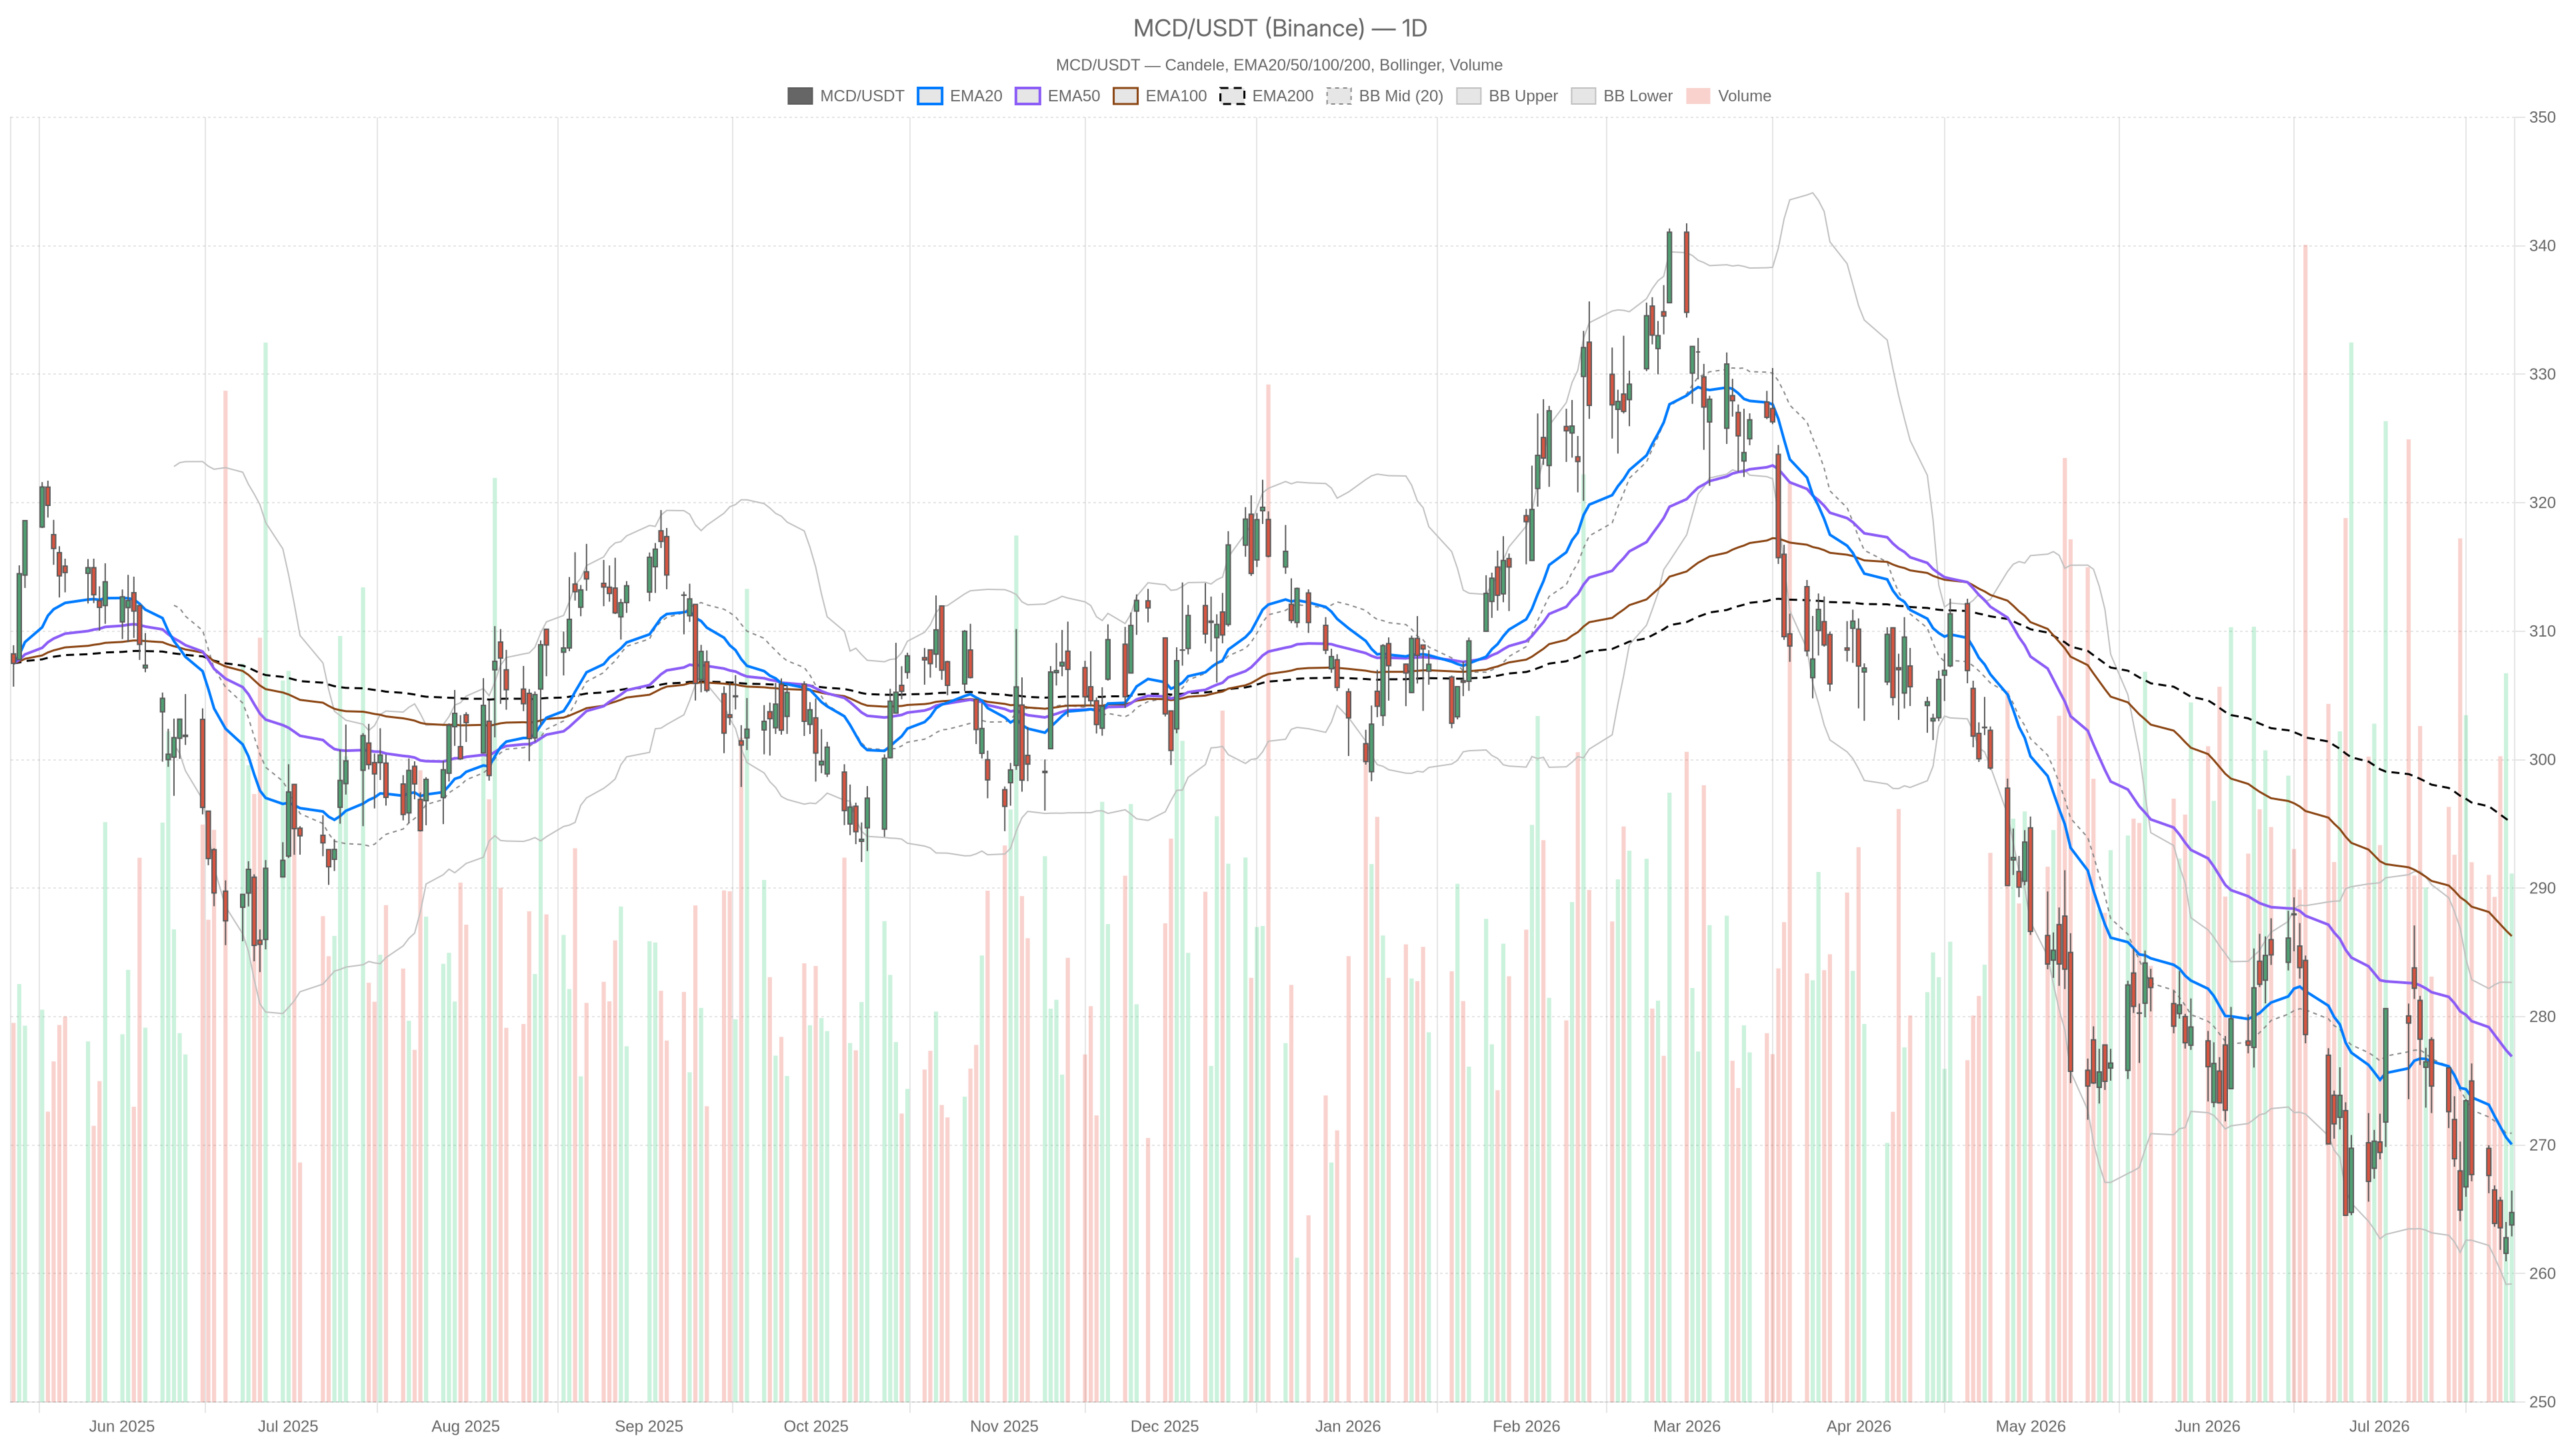 MCD — daily chart with candlesticks, EMA20/EMA50 and volume.
Key takeaways
- MCD closed at $264.76 on July 24, sitting beneath EMA20 ($270.06), EMA50 ($276.91), and EMA200 ($295.10).
- Daily RSI at 41.31 confirms bearish momentum with room to fall before reaching oversold territory.
- The MACD histogram is widening on the downside, reflecting accelerating bearish pressure rather than exhaustion.
- A quarterly dividend of $1.86 per share was declared, payable September 16, 2026 — offering income-oriented support.
- The 52-week low at $261.41 is the immediate floor; a break below exposes the daily lower Bollinger Band at $259.20.
Daily Bias — Bearish Structure Firmly in Place
McDonald’s Corporation stock remains locked in a firmly bearish daily structure, with price deeply embedded beneath all three exponential moving averages. The stacked bearish alignment leaves bulls with virtually no technical cover. MCD’s close at $264.76 sits well below the EMA20 at $270.06, the EMA50 at $276.91, and the EMA200 at $295.10.
Meanwhile, the daily RSI at 41.31 confirms subdued momentum without yet reaching oversold extremes. This distinction matters: there is still room for the stock to slide further before a mechanical bounce becomes likely. The daily MACD shows the line at -3.68 against a signal of -2.98, with a negative histogram reading of -0.70. Notably, the MACD histogram is widening on the downside, pointing to accelerating bearish momentum rather than exhaustion.
Daily ATR sits at $5.54, reflecting moderate but meaningful intraday swings. That level of volatility, combined with a price structure trapped beneath all key averages, makes counter-trend trades carry elevated risk. The daily pivot at $264.71 sits almost exactly at the close. Resistance at R1 ($266.51) and support at S1 ($262.95) define a tight near-term range.
Hourly Picture — A Flicker of Stabilization
The hourly chart shows early signs of stabilization for McDonald’s Corporation stock, though the broader bearish structure remains fully intact. The hourly regime is neutral. Price has recovered to sit essentially at the EMA20 of $264.42. After weeks of directional selling, MCD is at least finding equilibrium intraday — a meaningful short-term development.
However, the hourly EMA50 at $266.14 and EMA200 at $271.88 remain overhead obstacles. Price sits beneath both, and any rally attempt will encounter supply at those levels. The hourly RSI at 50.19 sits exactly at the midpoint. It is neither bullish nor bearish, confirming the stalemate.
Notably, the hourly MACD histogram has turned positive at +0.39, with the line crossing above the signal. That offers a modest constructive signal on the intraday frame, suggesting some short-term buying interest has entered. The 1H Bollinger Band upper at $266.28 and lower at $261.18 frame the range neatly. Price hovers near the midpoint — consistent with a pause rather than a recovery. The hourly ATR of $1.39 reflects compressed intraday volatility.
15-Minute Context — Indecision at a Pivotal Level
The 15-minute chart on McDonald’s Corporation stock shows pure indecision, with no directional edge emerging from the shortest timeframe. Price closed at $264.75, sitting just above the EMA50 at $264.44 but beneath the EMA200 at $266.50. The 15m RSI at 50.26 mirrors the hourly reading almost exactly. The MACD histogram is slightly negative at -0.16, hinting at a minor loss of short-term momentum.
Overall, the 15-minute frame is best read as a consolidation zone. For short-term traders, the tight range between pivot support at $264.33 and resistance at $265.17 defines the immediate battleground. A clean break in either direction would likely set the tone for the next intraday leg.
Fundamental Backdrop — Dividend Support and Consumer Pressure
On the fundamental side, McDonald’s Corporation stock faces a tug-of-war between dividend support and growing consumer headwinds.
Dividend Cushion at Depressed Levels
McDonald’s Board declared a quarterly cash dividend of $1.86 per share, payable on September 16, 2026, to shareholders of record as of September 1, 2026. That yield provides income-oriented support at current depressed levels. In a falling price environment, dividend declarations can slow institutional selling among income-focused holders.
Consumer Headwinds Weigh on Sentiment
In contrast, broader consumer dynamics are adding headwinds. Market commentary notes that consumers have less discretionary money to spend and are visiting restaurants less frequently. That backdrop applies directly to McDonald’s revenue model. Even as a value-oriented fast food leader, MCD is not immune to reduced traffic when household budgets tighten.
The comparison with Starbucks and Domino’s in current analyst discussions reflects a sector-wide reassessment of restaurant stocks under macroeconomic pressure. At the same time, speculation has emerged around whether Berkshire Hathaway’s Greg Abel might revisit the stock. The alignment with Warren Buffett’s long-standing investment criteria is notable, though speculative. It can attract attention from value-oriented investors watching for entry points near multi-year lows.
Bullish Scenario — What Would Need to Change
For a credible bullish recovery in McDonald’s Corporation stock, MCD must reclaim the EMA20 at $270.06 on a daily closing basis. That level represents the first meaningful resistance above current prices. A move through that zone would need to be accompanied by a daily RSI recovery above 50 and a MACD histogram turning positive. Together, those signals would suggest the distribution phase is losing momentum.
Additionally, the dividend announcement could serve as a near-term stabilizer, drawing income-focused buyers. Any positive earnings catalyst or improved consumer spending data could provide the fundamental fuel the technical picture currently lacks. On the upside, the daily Bollinger Band mid at $270.94 and the EMA50 at $276.91 represent the key recovery checkpoints.
Bearish Scenario — The Path of Least Resistance Remains Lower
The bearish case for McDonald’s Corporation stock remains well-supported, with the path of least resistance pointing lower. The daily lower Bollinger Band at $259.20 is the next natural target if the 52-week low at $261.41 gives way. A break below that level on volume would confirm a structural breakdown and likely accelerate selling from momentum-driven participants.
Meanwhile, the MACD histogram continues to widen on the daily frame. Combined with an RSI that still has room to fall before reaching oversold territory, the bearish trend has technical momentum behind it. Consumer pressure narratives and sector-wide scrutiny of restaurant stocks do not provide a near-term catalyst for reversal.
Positioning and Volatility — Managing Uncertainty Near the Lows
McDonald’s Corporation stock presents a classic late-stage bearish setup. It is extended enough to attract value interest but not technically resolved enough to justify aggressive long positioning. The daily structure remains bearish, the hourly is at best neutral, and the 15-minute offers no directional conviction. The timeframes are not in outright conflict. Rather, they describe a stock pausing within a downtrend rather than reversing it.
Overall, daily ATR sits at $5.54 and the price hugs pivot levels. The next meaningful move will likely be determined by either a catalyst-driven volume event or a clean technical break. Specifically, a move above $266.51 or below $262.95 would set the tone. Until the daily trend structure shifts, the burden of proof remains on the bulls.
FAQ
Is McDonald’s Corporation stock still in a bearish trend?
The daily chart remains firmly bearish. MCD closed at $264.76, well below the EMA20 ($270.06), EMA50 ($276.91), and EMA200 ($295.10). The MACD histogram is widening on the downside, and the RSI at 41.31 has room to fall further before reaching oversold conditions.
What are the key support levels for MCD?
The immediate floor is the 52-week low at $261.41. Below that, the daily lower Bollinger Band at $259.20 is the next natural target. On the upside, resistance sits at R1 ($266.51) and the EMA20 ($270.06).
Does the dividend announcement change the technical outlook?
The $1.86 per share quarterly dividend provides income-oriented support and may slow institutional selling. However, it does not alter the bearish daily structure. A recovery requires a daily close above the EMA20 at $270.06.
What would confirm a bullish reversal for McDonald’s Corporation stock?
A credible reversal requires MCD to reclaim the EMA20 at $270.06 on a daily closing basis, accompanied by a daily RSI recovery above 50 and a MACD histogram turning positive. Until those conditions align, the bearish structure remains in control.
Disclaimer: This article is for informational purposes only and does not constitute financial advice, an investment recommendation, or a solicitation to buy or sell any financial instrument or cryptocurrency. The analysis provided is not indicative of future results. Investing in crypto assets and financial markets carries a high risk of capital loss. Always do your own research (DYOR) and consult a qualified financial advisor before making any decision.
Article produced with the assistance of artificial intelligence and reviewed by the editorial team.









 English (US) ·