
 2 hours ago
23
2 hours ago
23
Nvidia stock is sending a mixed message. Blockbuster earnings have not prevented a short-term momentum pullback, with intraday sellers still setting the tone. This split between fundamentals and price action defines the NVDA setup heading into the next sessions.
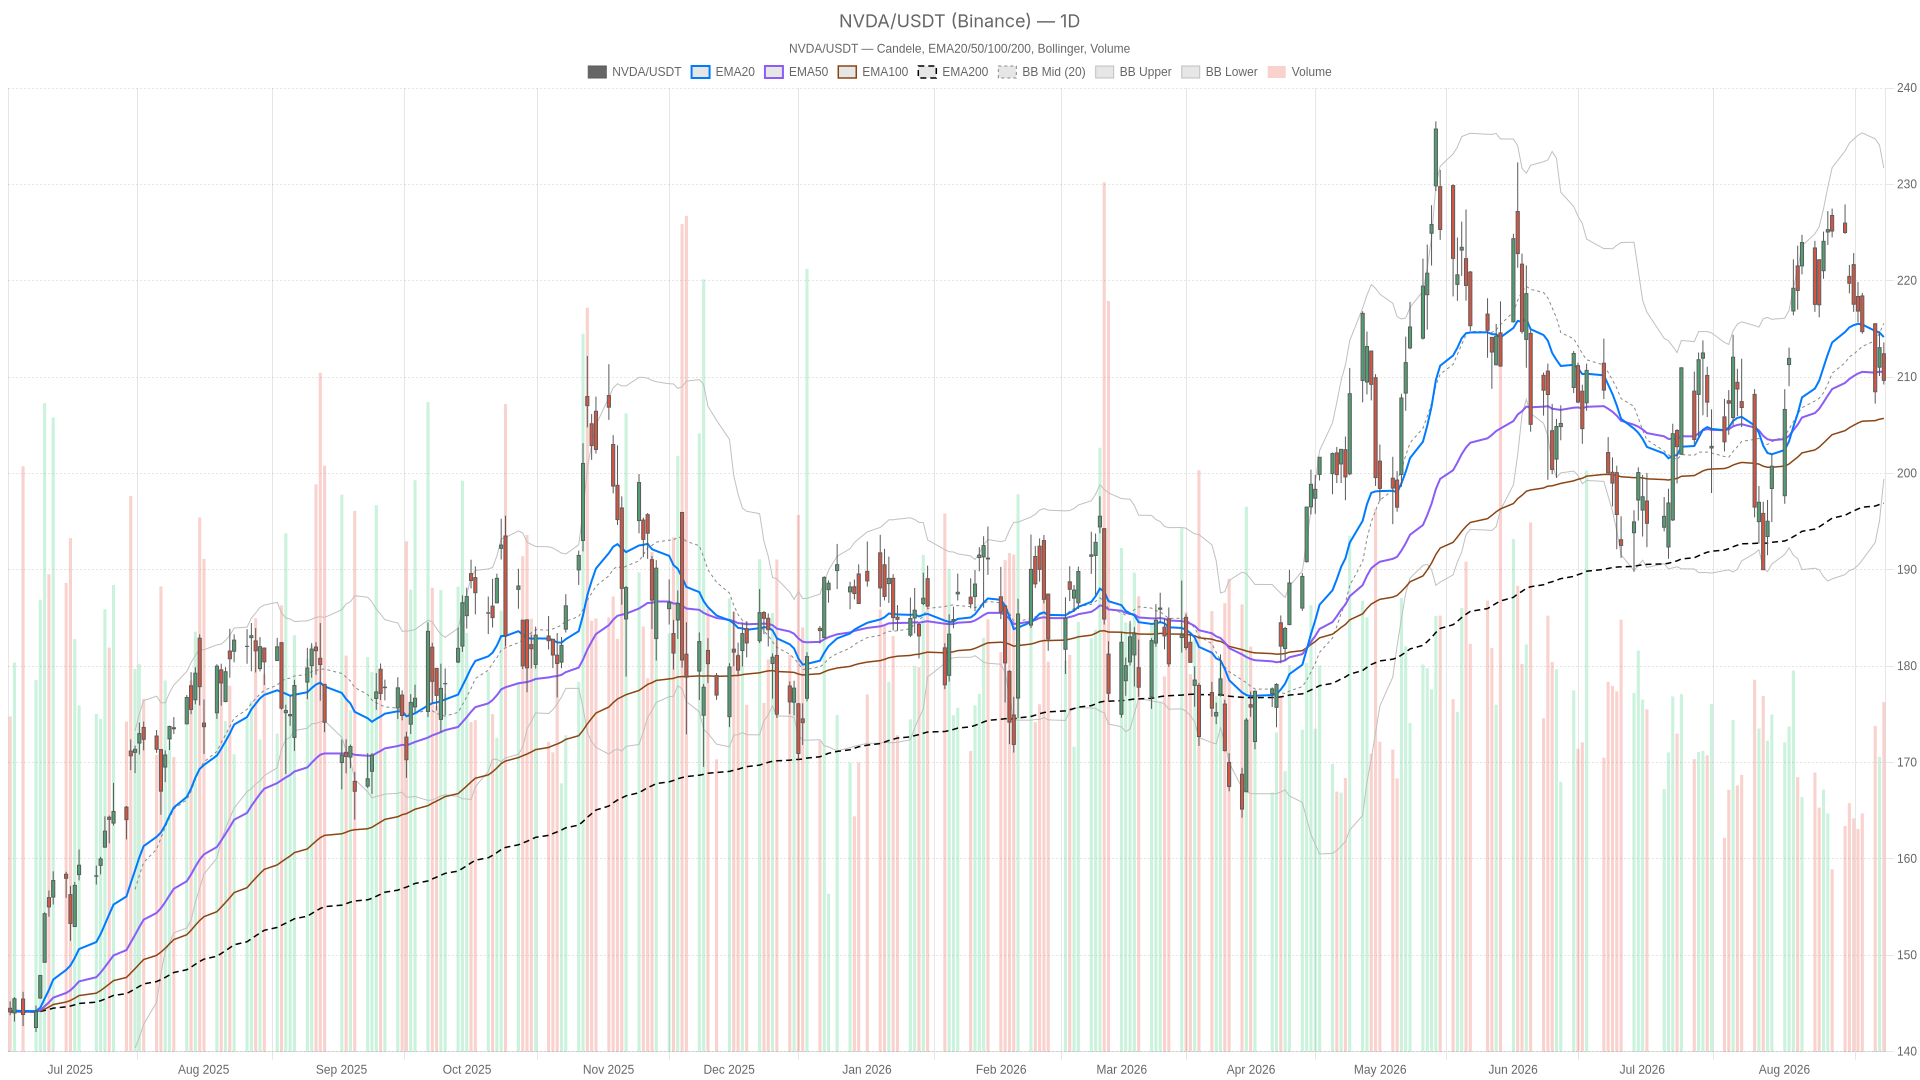 NVDA — daily chart with candlesticks, EMA20/EMA50 and volume.
Key takeaways
- NVDA closed at 209.66, below its daily EMA20 at 214.15 but above the EMA50 at 210.53.
- The daily MACD shows a bearish crossover, with the line at 1.54 below the signal at 3.07.
- Q2 results beat expectations, and memory-related purchase commitments more than doubled to $279 billion.
- The daily pivot sits at 210.83, with support at 208.06 and resistance at 212.43.
- Hourly price at 209.95 trades below all three moving averages, confirming short-term weakness.
Nvidia Stock Daily Structure: Momentum Fatigue, Not a Breakdown
Nvidia stock remains in a neutral-to-corrective phase rather than an outright bearish trend. The broader uptrend is still structurally intact. However, the stock has slipped beneath its short-term moving average following the earnings reaction. It closed at 209.66, down from an open of 212.42 and well off the session high of 213.60. Price sits below the EMA20 at 214.15, but still above the EMA50 at 210.53 and the EMA200 at 196.91.
Momentum and Volatility Signals
Meanwhile, momentum indicators reinforce this fatigue. The daily RSI14 sits at 46.29, a neutral reading showing neither oversold stress nor bullish strength. More telling is the MACD. The line at 1.54 sits below the signal at 3.07, producing a negative histogram of -1.53. That is a bearish crossover, and it suggests the recent rally has lost steam even as the earnings headlines were positive.
Bollinger Bands add useful context. The mid-band sits at 215.56, the upper band at 231.69, and the lower band at 199.43. Price trades below the midline but nowhere near the lower extreme. This points to a stock digesting recent gains inside its range rather than breaking down.
At the same time, the ATR14 of 5.44 confirms elevated but not extreme volatility. That is consistent with a post-earnings adjustment period. On the pivot framework, the daily pivot point sits at 210.83, with resistance at 212.43 and support at 208.06. NVDA closed below the pivot. This places the near-term battle between the pivot and that 208.06 support.
Nvidia Stock Hourly Chart: Short-Term Weakness Deepens
Nvidia stock shows clearer weakness on the hourly chart, trading below all three moving averages. Price at 209.95 sits below the EMA20 at 211.58, the EMA50 at 214.25, and the EMA200 at 212.47. That is a fully bearish moving average stack on the hourly chart. It reinforces the daily MACD signal rather than contradicting it.
However, momentum tells a slightly more nuanced story. RSI14 on the 1H stands at 39.57, notably weaker than the daily reading and edging toward oversold territory without confirming it outright. The MACD line at -1.24 sits just above the signal at -1.43, producing a small positive histogram of 0.19. That is an early sign that hourly selling pressure may be losing some intensity.
Bollinger Bands on this timeframe place price near the lower band at 208.51, relative to the mid at 210.81 and the upper at 213.11. That is consistent with a market pushing toward the edge of its short-term range. The hourly pivot at 210.06, with support at 209.12, puts current price right at the lower boundary of that intraday structure.
Overall, the 1H timeframe sharpens the daily bias rather than contradicting it. The daily chart shows fatigue, while the hourly chart shows outright weakness. Still, the tentative MACD histogram uptick is worth watching for signs of stabilization.
15-Minute Chart: Execution Context for NVDA
The 15-minute chart is labeled bearish and exists purely for timing execution. Price at 209.95 sits below the EMA20 at 210.60, the EMA50 at 211.14, and the EMA200 at 214.79. That matches the hourly alignment. RSI14 at 42.23 is soft but not extreme, while the MACD histogram is essentially flat at 0.01. That suggests momentum has stalled rather than accelerated to the downside.
Notably, Bollinger Bands here are tight. The mid sits at 210.45, the upper at 211.45, and the lower at 209.44. The reduced ATR14 of 0.63 reflects a market compressing after the volatility of the earnings reaction. The 15m pivot sits at 209.77, almost exactly where price is trading, with resistance at 210.31 and support at 209.41.
In short, the very short-term chart shows a market pausing right at a decision point. There is no clear directional push in either direction yet.
Bullish Scenario for Nvidia Stock
The bullish case depends on Nvidia stock reclaiming its short-term moving averages and confirming that fundamentals can reassert themselves technically. If NVDA reclaims the daily EMA20 at 214.15, it would begin repairing the daily MACD structure. Holding above the EMA50 at 210.53 would add confidence. A push toward the daily pivot resistance at 212.43 would signal buyers returning. The next target would be the Bollinger mid-band at 215.56.
Meanwhile, support for this scenario comes directly from the news flow. Triple-digit AI revenue growth, guidance that beat estimates, and the sharp increase in memory purchase commitments to $279 billion all point to sustained demand visibility. That news even triggered a surge in memory stocks overnight. Should hourly momentum confirm with a building positive MACD histogram, the short-term weakness could prove to be a shakeout. Price remains far above the daily EMA200 at 196.91.
Bearish Scenario and Invalidation Levels
The bearish scenario would be confirmed by a break below the daily S1 support at 208.06. That would open the door toward a deeper test of the lower Bollinger region near 199.43. A failure of the EMA50 at 210.53 to hold as support would add pressure. Combined with continued hourly trading below all three moving averages, that would validate the current bearish MACD crossover on the daily chart.
In this scenario, the market would treat the earnings beat and the $279 billion in memory purchase commitments as already priced in. Attention would shift instead to the technical breakdown. The key invalidation for bulls is straightforward. If NVDA cannot reclaim the daily EMA20 and instead loses the 208.06 support, the corrective move risks extending further.
Therefore, the setup right now is genuinely two-sided. The daily chart shows a stock in a fatigue phase rather than a trend reversal. The hourly chart confirms near-term weakness with only a faint hint of stabilization. The 15-minute chart is sitting right at a pivot with a bearish regime label. Given elevated ATR readings across timeframes and a news backdrop that remains fundamentally constructive, volatility around Nvidia stock is likely to stay elevated. Positioning should account for that uncertainty, since the technical and fundamental narratives are pulling in different directions.
FAQ
Why is Nvidia stock weak despite strong earnings?
The daily MACD shows a bearish crossover, with the line at 1.54 below the signal at 3.07. NVDA also closed below its daily EMA20 at 214.15. The market may be treating the earnings beat and the $279 billion in memory purchase commitments as already priced in.
What is the key support level for NVDA?
The daily S1 support sits at 208.06. A break below that level would open the door toward the lower Bollinger region near 199.43.
What levels matter for a bullish recovery in Nvidia stock?
Bulls need NVDA to reclaim the daily EMA20 at 214.15 and hold above the EMA50 at 210.53. The next upside references are the daily pivot resistance at 212.43 and the Bollinger mid-band at 215.56.
Is the long-term uptrend still intact?
Yes, on the daily chart NVDA remains above the EMA200 at 196.91. The broader uptrend is structurally intact, but short-term momentum is showing fatigue.
Disclaimer: This article is for informational purposes only and does not constitute financial advice, an investment recommendation, or a solicitation to buy or sell any financial instrument or cryptocurrency. The analysis provided is not indicative of future results. Investing in crypto assets and financial markets carries a high risk of capital loss. Always do your own research (DYOR) and consult a qualified financial advisor before making any decision.
Article produced with the assistance of artificial intelligence and reviewed by the editorial team.





 English (US) ·