
 6 hours ago
22
6 hours ago
22
Oracle Corporation stock faces a sharp contradiction. A landmark $7 billion Pentagon contract landed after hours on July 23. Yet the shares hit a 52-week low during the same session. Every technical timeframe remains deeply bearish. Can a single government deal override months of deteriorating price structure?
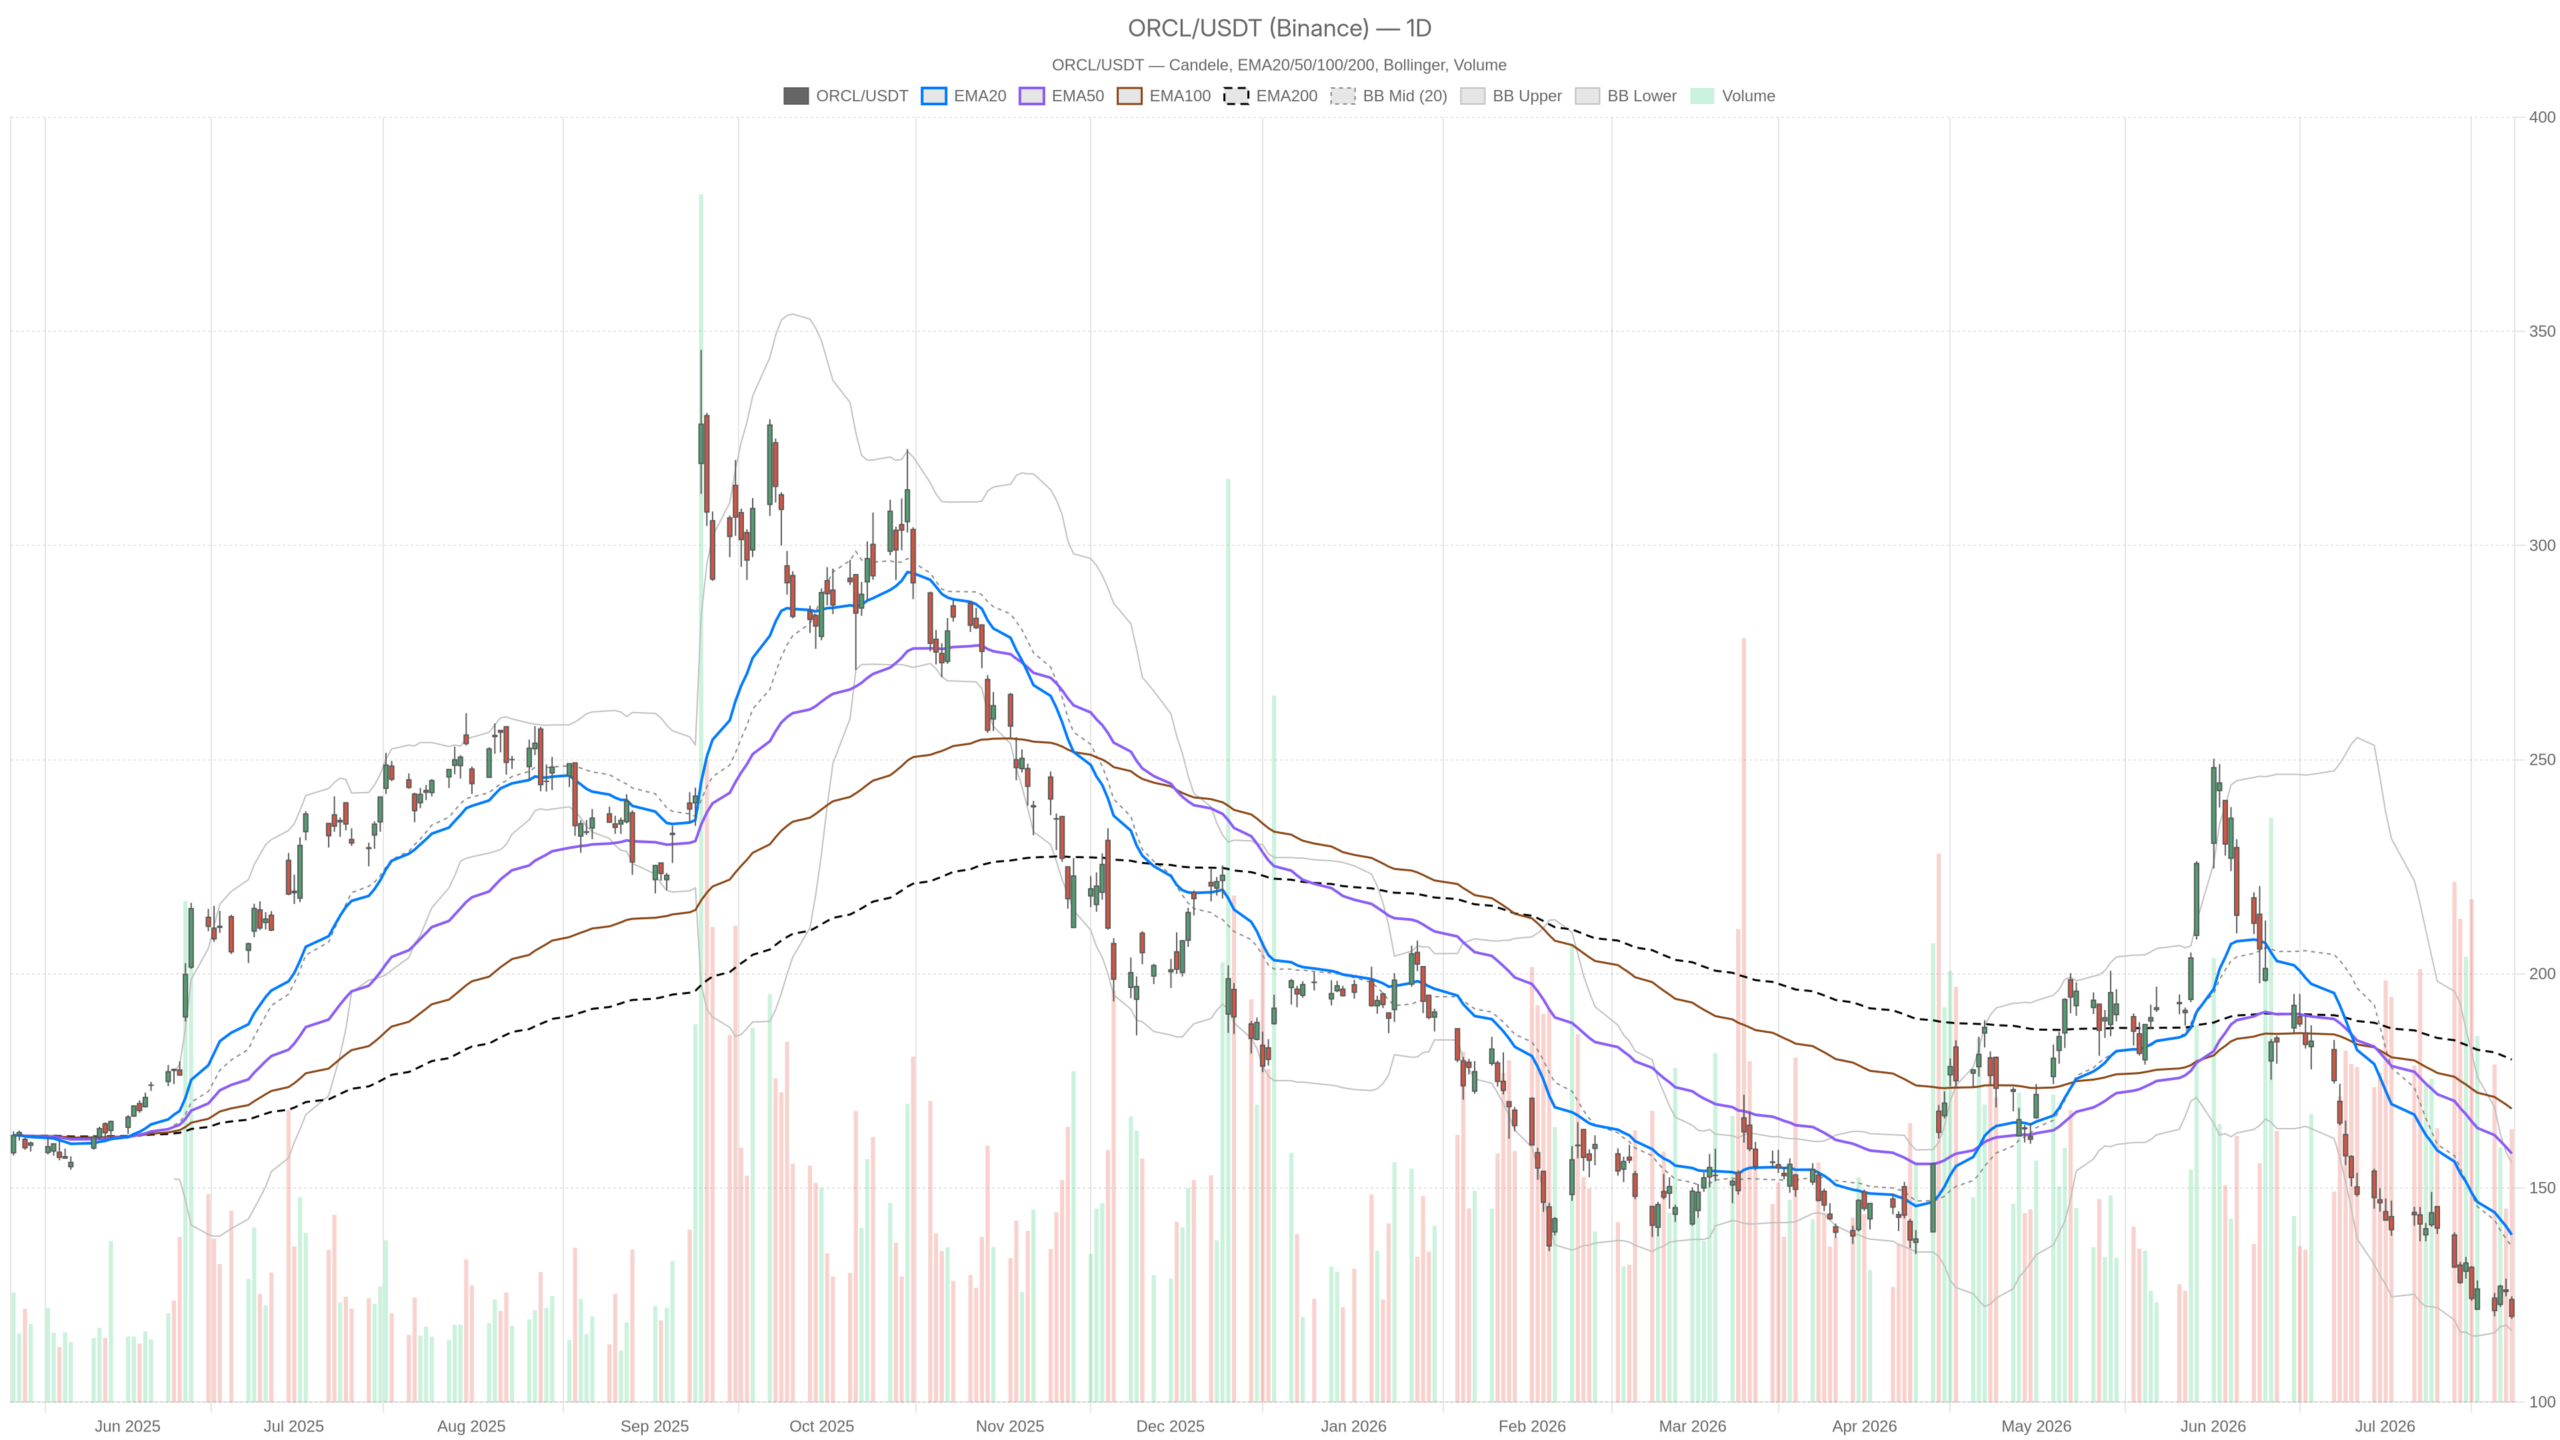 ORCL — daily chart with candlesticks, EMA20/EMA50 and volume.
Key takeaways
- Oracle Corporation stock closed at $120.04 on July 23, hitting a 52-week low during the regular session.
- Price trades nearly $60 below its 200-day EMA of $179.98, reflecting multi-month institutional distribution.
- A 10-year Pentagon software contract worth up to $7 billion was announced after the market close.
- Daily RSI sits at 29.63, deep in oversold territory within a strong downtrend.
- Analyst fair value estimate rose to $248.15, implying over $128 in potential upside per share.
Daily Timeframe: The Bias Is Bearish, and Deeply So
The daily chart for Oracle Corporation stock is unequivocally bearish. Price closed at $120.04, nearly $60 below its 200-day EMA of $179.98. All three moving averages are stacked in a classic bearish cascade. This reflects sustained institutional distribution over several months.
Trend Structure and Moving Averages
The EMA20 sits at $139.07 while the EMA50 is at $158.03. Price trades far below both, confirming the downtrend’s depth. Notably, a deviation this large is not minor. It signals persistent selling pressure across multiple timeframes.
Momentum and Volatility Signals
The daily RSI sits at 29.63, which is technically oversold territory. However, oversold readings in a strong downtrend are not automatic reversal signals. They confirm that selling pressure has been relentless. The MACD line at -14.18 remains below the signal line at -14.40. Still, the histogram has edged to a slight positive of 0.22. That micro-uptick hints at fading downside momentum. It is far too early to call a reversal on that basis alone.
Bollinger Bands reinforce the stress. The lower band sits at $116.70 and the midline at $136.28. Price is hugging the lower extreme, signaling extended selling. The daily ATR of $6.56 confirms significant intraday volatility. Meanwhile, pivot levels show a pivot point at $121.39. Resistance sits at $123.35 and support at $118.09. These levels are compressed within a tight zone. The market is coiling near critical ground. Overall, the D1 regime is classified as bearish. Nothing in the indicator set contradicts that verdict.
Hourly View: Bears in Control, but Momentum Is Slipping
The 1-hour chart confirms the bearish bias across all three moving averages. However, selling momentum shows early signs of exhaustion. Price at $120.04 sits below the H1 EMA20 at $123.23, EMA50 at $126.50, and EMA200 at $147.85. The bearish structure remains intact. The hourly RSI has crept up to 35.36. That reading is still oversold but notably higher than the daily figure. This slight divergence suggests short-term selling may be losing urgency at current levels.
In contrast, the hourly MACD tells a more cautious story. The line at -1.68 is below the signal at -1.18, with a negative histogram of -0.50. That means momentum on the hourly is still rolling over to the downside. The Bollinger Band lower boundary sits at $118.78. Price is currently inside the lower half of the band. The hourly ATR of 1.86 implies roughly $1.86 of expected movement per hour. That is meaningful for short-term traders but not yet indicative of a volatility expansion. Overall, the 1H timeframe weakens the bullish case without providing a clear reversal trigger.
15-Minute Execution Context: Tentative Stabilization
The 15-minute chart signals tentative stabilization rather than a directional move. The MACD histogram turned slightly positive at 0.13. This suggests immediate downside pressure may be temporarily exhausting itself. Price is sitting near the 15m pivot point of $119.89, with resistance at $120.34 and support at $119.58.
Meanwhile, the Bollinger Bands have tightened significantly. The upper band sits at $121.29 and the lower at $119.31. This compression often precedes a sharper directional move once a catalyst triggers conviction. The 15m RSI at 37.41 remains depressed but is not at an extreme. Therefore, this timeframe is best read as a waiting zone, not a directional signal.
The Pentagon Contract: A Fundamental Wildcard for Oracle Corporation Stock
The Pentagon deal is a material development that could reshape Oracle Corporation stock’s narrative. However, it has yet to be reflected in price structure. Oracle signed a 10-year software contract with the U.S. Department of Defense, valued at up to $7 billion, to supply on-premises software. The stock rose in after-hours trading on the news. Retail sentiment, as tracked on Stocktwits, turned constructive. Some participants also noted potential spillover benefits for enterprise software peers.
Separately, analysts updated their fair value estimate to $248.15, up from $242.10. That figure reflects a tug of war between those emphasizing long-term AI and cloud demand, and those flagging margin risks. The gap between the current price of $120.04 and the updated fair value estimate is substantial — over $128 per share. That kind of discount either signals a deep value opportunity or points to serious near-term execution risk. The market has not yet priced away that uncertainty.
Notably, multiple outlets flagged that Oracle hit a 52-week low during the same session the Pentagon deal was announced. That combination — a major government contract alongside a fresh multi-month low — creates precisely the tension that drives inflection points in both directions.
Bullish Scenario: What Oracle Corporation Stock Would Need to Recover
For Oracle Corporation stock to stage a genuine recovery, it must reclaim the daily pivot at $121.39 and close above the H1 EMA20 at $123.23. A sustained move through resistance at $123.35 would begin to shift short-term momentum. The Pentagon deal provides a credible fundamental anchor. If institutional buyers step in, the oversold daily RSI could accelerate the snap-back. The revaluation would rest on a longer-term AI and government contract thesis.
Therefore, the bullish case rests on three conditions. First, confirmation that after-hours gains hold into the regular session. Second, reclaiming the pivot zone around $121–$123. Third, a stabilization in the broader tech sector, which has been under pressure during the same period. The analyst fair value at $248.15 offers a long runway if the thesis holds.
Bearish Scenario: Why the Charts Still Dominate
Technical damage of this severity rarely reverses on a single headline. Price trading $60 below its 200-day EMA reflects a multi-month unwinding of positions. On the other hand, a 52-week low hit on the same day as a positive contract announcement is revealing. It suggests selling pressure was not primarily driven by a lack of contract wins. Other factors — including broader tech sector selling and company-specific concerns — have weighed on Oracle Corporation stock independently.
If the after-hours rally fades and price fails to reclaim $121.39 in the regular session, the next support reference is $118.09. That is the daily S1 pivot. Below that, the Bollinger lower band at $116.70 becomes the structural floor to watch. A break below that level would signal another leg down. It would invalidate any near-term recovery thesis entirely.
Positioning, Volatility, and the Uncertainty Ahead
Oracle Corporation stock is operating in a high-uncertainty environment. Fundamentals and technicals are pulling in opposite directions. The daily ATR of $6.56 reflects the kind of volatility that rewards neither passive holders nor reactive traders without a clear plan. The Pentagon deal is a real, material development. Yet price structure, momentum, and trend all remain bearish across every measured timeframe.
Until the charts show evidence of genuine institutional accumulation, the burden of proof sits with the bulls. An after-hours spike alone is not enough. The next two to three sessions will be decisive. They will determine whether this is an inflection point or just a relief bounce in a continuing downtrend.
FAQ
Why did Oracle Corporation stock hit a 52-week low despite the Pentagon deal?
The Pentagon contract was announced after the market close on July 23. During the regular session, Oracle Corporation stock traded down to a 52-week low of $120.04. The selling pressure reflected broader tech sector weakness and company-specific concerns that the contract news had not yet offset.
What are the key levels to watch for Oracle Corporation stock?
The daily pivot at $121.39 is the immediate level bulls must reclaim. Resistance sits at $123.35. On the downside, support rests at $118.09, with the Bollinger lower band at $116.70 serving as the structural floor. A break below that would signal another leg down.
Is Oracle Corporation stock oversold and due for a bounce?
The daily RSI at 29.63 is technically oversold. However, oversold readings in strong downtrends are not automatic reversal signals. They confirm relentless selling pressure. The MACD histogram shows a slight positive tick, hinting at fading momentum, but that alone is insufficient to call a reversal.
What is the analyst fair value for Oracle Corporation stock?
Analysts recently updated their fair value estimate to $248.15, up from $242.10. At the current price of $120.04, the gap exceeds $128 per share. This discount reflects competing views on long-term AI demand versus near-term margin risks.
Disclaimer: This article is for informational purposes only and does not constitute financial advice, an investment recommendation, or a solicitation to buy or sell any financial instrument or cryptocurrency. The analysis provided is not indicative of future results. Investing in crypto assets and financial markets carries a high risk of capital loss. Always do your own research (DYOR) and consult a qualified financial advisor before making any decision.
Article produced with the assistance of artificial intelligence and reviewed by the editorial team.






 English (US) ·