
 1 month ago
35
1 month ago
35

Qualcomm stock holds a structurally bullish posture after a 48% annual run, with AI diversification deals providing fundamental support. Yet softening daily momentum and elevated volatility near $233 resistance call for near-term caution as bulls defend key levels.
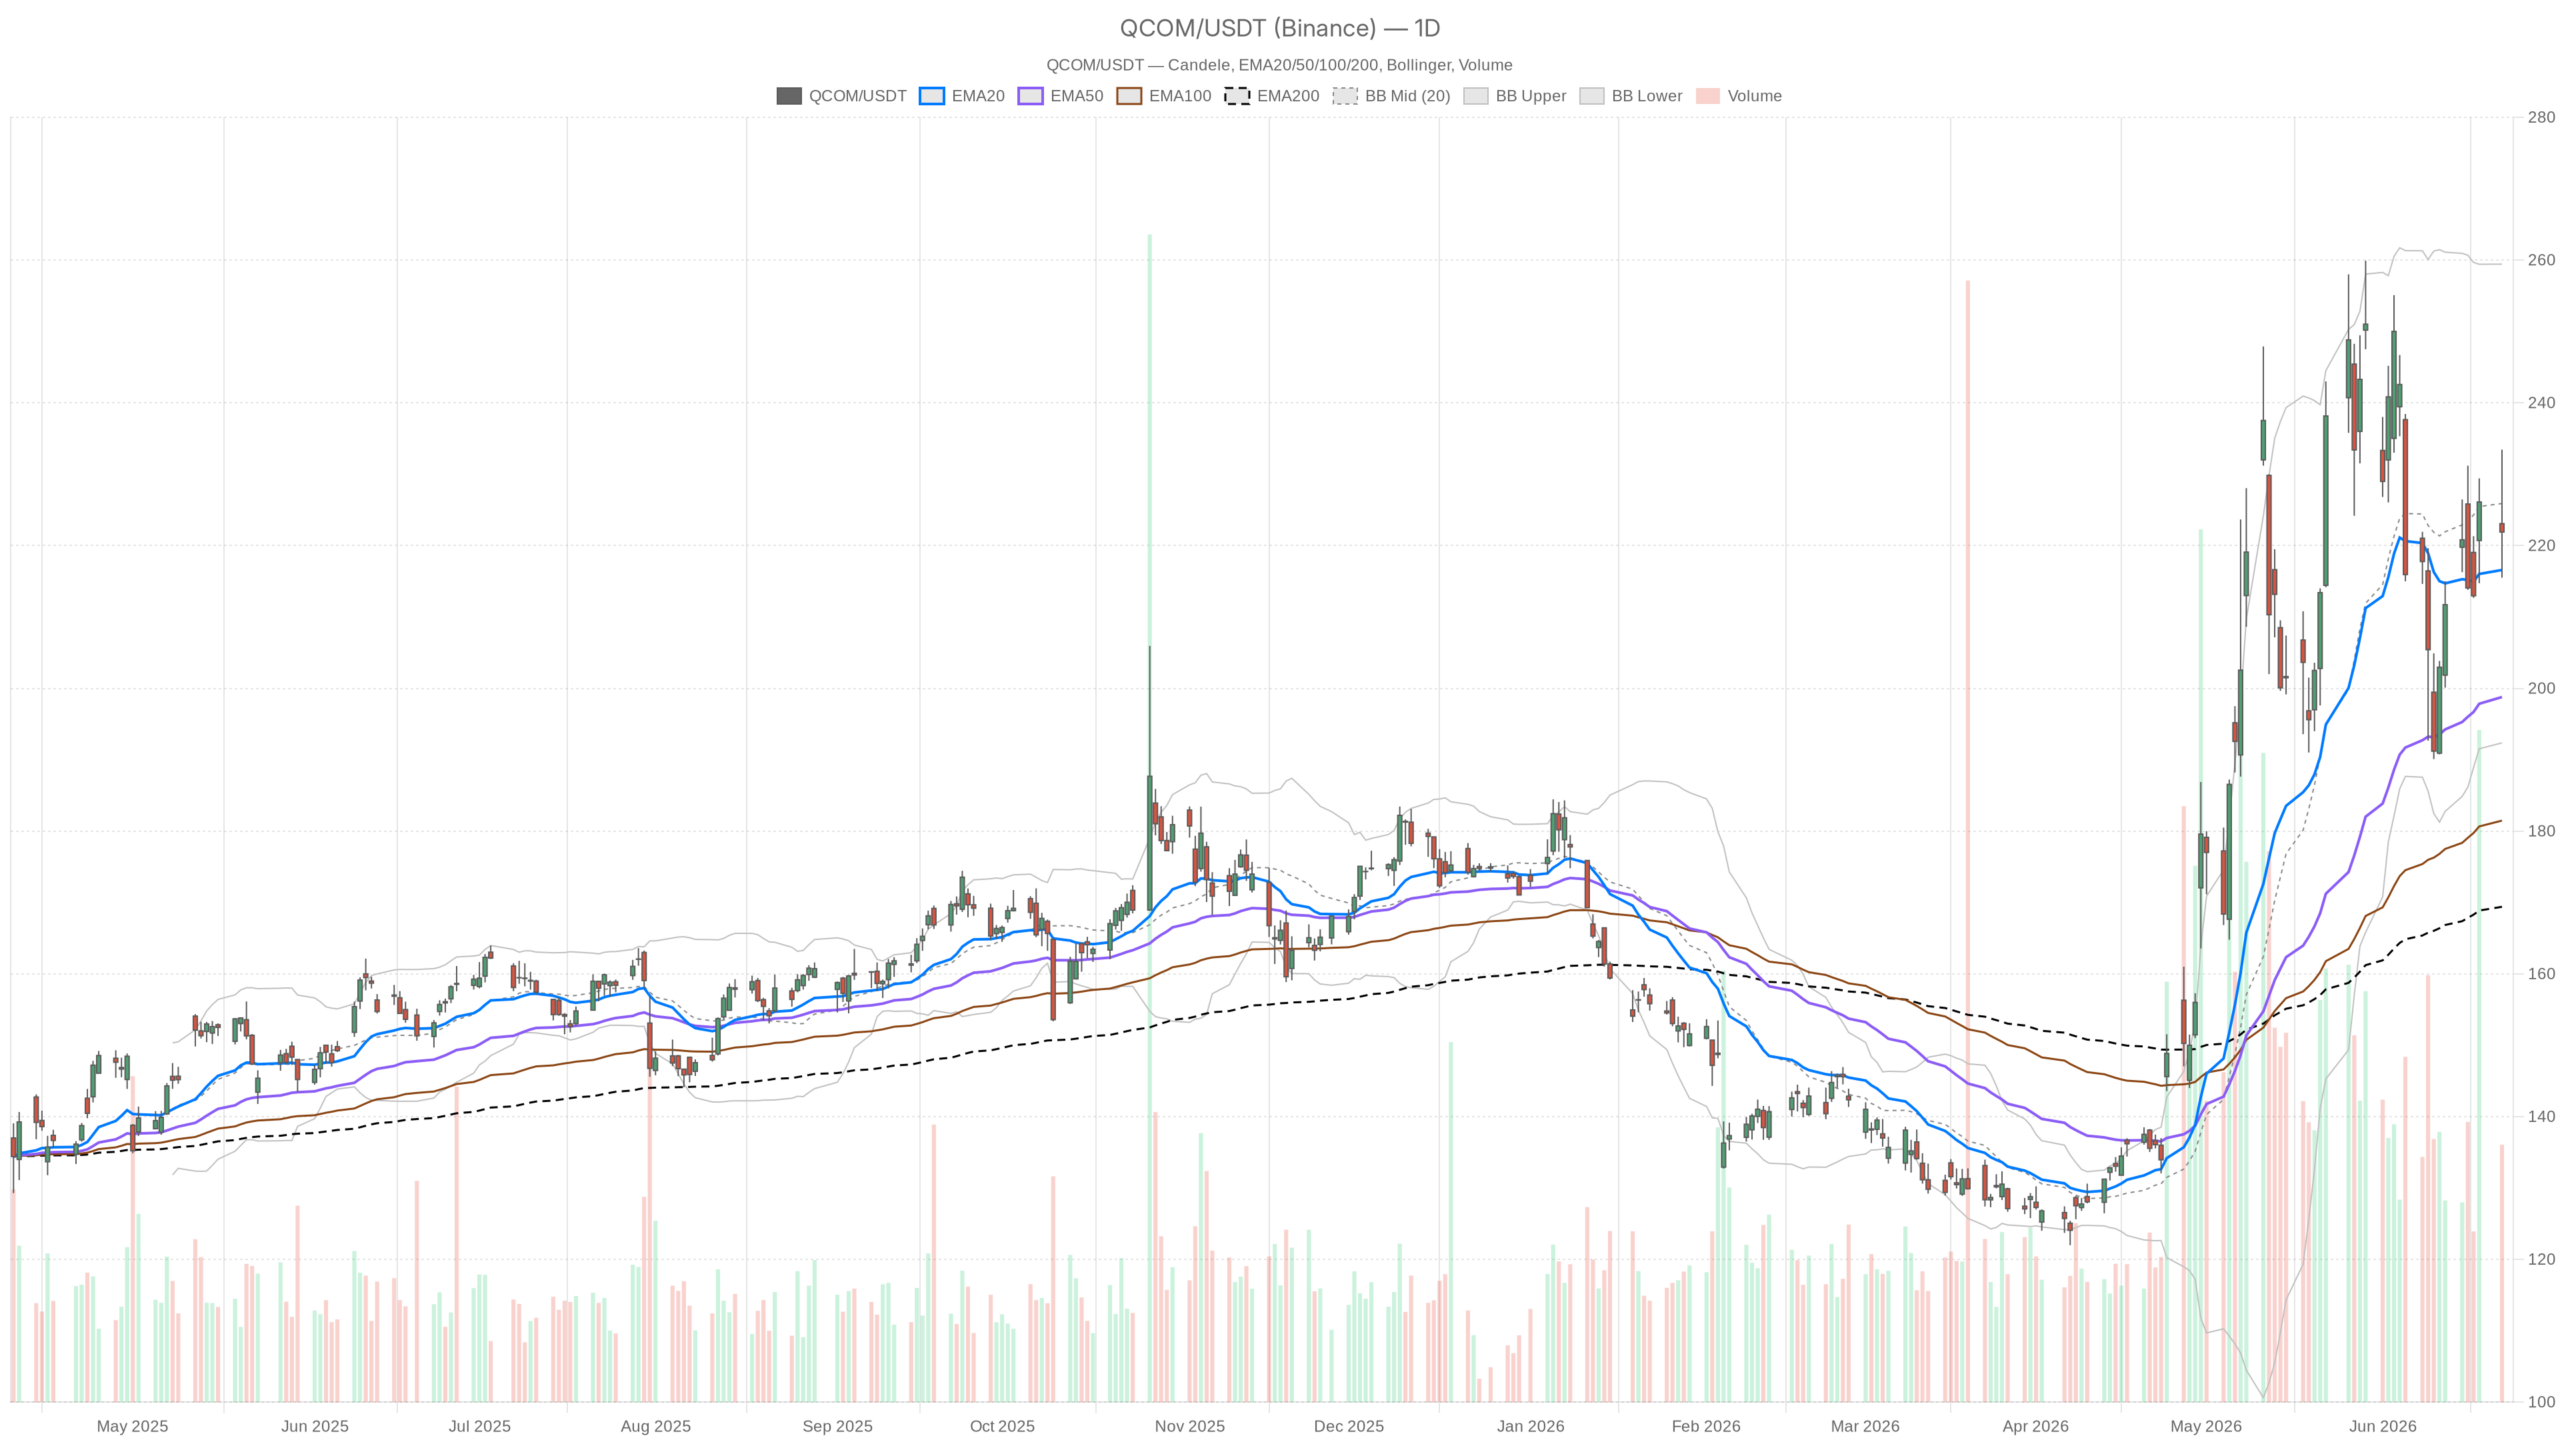 QCOM — daily chart with candlesticks, EMA20/EMA50 and volume.
Key takeaways
- Qualcomm stock closed at $221.90 on June 22, pulling back from an intraday high of $233.44, signaling elevated volatility near resistance.
- The daily EMA stack remains firmly bullish, with price trading above the 20-day, 50-day, and 200-day moving averages.
- Daily MACD histogram at -2.43 and RSI at 53.57 confirm the uptrend is consolidating rather than accelerating.
- Bank of America raised its price target on QCOM, and the company is in advanced talks to acquire Modular Inc. in a deal valued at roughly $4 billion.
- A break below daily S1 at $213.79 or the 20-day EMA at $216.58 would materially challenge the bullish thesis.
Qualcomm Stock Daily Chart: Bullish Regime, Softening Momentum
Qualcomm stock remains in a structurally bullish regime on the daily chart. The EMA stack confirms the uptrend, with price at $221.90 sitting above all three key moving averages.
EMA Stack Confirms Uptrend Health
Currently, QCOM trades well above the 50-day EMA at $198.79 and the 200-day EMA at $169.40. The 20-day EMA at $216.58 acts as the nearest dynamic support. This layered EMA structure reflects a stock in a healthy medium-term uptrend. Price sitting above all three moving averages is a textbook sign of trend health.
MACD and RSI Signal Consolidation
However, the MACD histogram at -2.43 warrants caution. The MACD line at 4.70 remains above zero — still technically positive — but has crossed below the signal line at 7.12. That divergence suggests the recent upward impulse is losing steam. This is not a reversal signal on its own. Rather, it indicates the trend is consolidating instead of accelerating.
Daily RSI at 53.57 is consistent with this reading. It sits above the neutral 50 mark, confirming the bullish bias, yet remains far from overbought territory. The RSI level reflects a market catching its breath after a strong run, with room to move in either direction.
Bollinger Bands and Pivot Levels
Bollinger Bands show price sitting between the midline at $225.90 and the lower band at $192.37. The upper band at $259.43 remains a distant target. Notably, the close near the midline suggests price has retreated from its recent expansion phase. Volatility, as measured by ATR at $16.87, remains elevated — the June 22 session’s near-$18 range confirms active repricing.
In terms of levels, the daily pivot point sits at $223.61. R1 resistance at $231.73 aligns closely with the prior session’s intraday high. S1 support at $213.79 is the level bears would need to test to materially challenge the bullish structure.
Hourly Timeframe: Neutral Regime Complicates the Picture
The hourly chart introduces meaningful friction for Qualcomm stock. The regime is classified as neutral. Short-term momentum has rolled over, with price at $221.97 sitting slightly below the hourly 20-EMA at $223.56.
EMA and MACD Signal Momentum Loss
The 50-EMA at $220.14 sits just below current price, providing a thin layer of support. Meanwhile, the 200-EMA at $212.80 remains well beneath, confirming the broader uptrend is intact on this timeframe as well. Hourly MACD is in negative histogram territory at -0.56. The MACD line at 2.35 sits below the signal line at 2.91, mirroring the daily dynamic. On the hourly timeframe, this configuration often precedes either a sideways grind or a modest pullback before any resumption attempt.
RSI and Pivot Compression Define the Range
At the same time, hourly RSI at 49.36 sits at the midpoint, confirming the neutral regime. The market is not stretched in either direction. The next directional move likely depends on fresh catalysts or a break of nearby pivot levels. The hourly pivot structure is tight: PP at $222.19, R1 at $223.11, and S1 at $221.06. QCOM is caught between these levels, trading in a compressed zone. A sustained break above $223.11 would signal hourly bullish recovery. In contrast, a close below $221.06 would open the door toward the $220 area and the hourly 50-EMA.
15-Minute Timeframe: Short-Term Sellers in Control
The 15-minute chart shows a more bearish tone, though this is purely an execution context. The 15m RSI at 37.99 approaches oversold territory without quite reaching it. That level often signals slowing selling pressure, but not necessarily a reversal. MACD on this timeframe is decisively negative. The histogram sits at -0.87, and the MACD line at -1.11 runs well below the signal at -0.25. Short-term sellers hold the edge.
Meanwhile, price at $221.97 sits below the 15-minute 20-EMA at $225.42 and the 50-EMA at $225.02. It remains only marginally above the 200-EMA at $220.38. The Bollinger midline on this timeframe is at $226.74. Current price hugs the lower half of the band, with the lower band at $220.98 acting as near-term support. A breach of that level would confirm continued short-term weakness.
Therefore, the 15m setup does not offer a compelling long entry yet. The RSI approaching oversold combined with the $220.38 200-EMA support could generate a bounce. However, dip-buyers would need confirmation — ideally a 15m MACD crossover or a reclaim of the $222.19 pivot — before positioning aggressively.
Bullish Scenario: AI Catalysts Drive a Resumption
The bullish case for Qualcomm stock is grounded in both technicals and fundamentals. Daily structure remains intact above the 20-EMA at $216.58 and well above the 50-EMA at $198.79. A recovery above the daily pivot at $223.61 would signal renewed buying interest. A push through R1 at $231.73 — reclaiming the prior session’s intraday high — would confirm the dip was absorbed and the uptrend is resuming.
Meanwhile, fundamental support for this scenario is meaningful. The BofA price target upgrade, the reported Modular acquisition, and the Tenstorrent discussions collectively frame Qualcomm as a serious AI infrastructure player. If the AI deal pipeline materializes and earnings visibility improves, QCOM could reassert its uptrend. The Bollinger upper band at $259.43 on the daily chart would become the target.
Bearish Scenario: Momentum Fade Meets Valuation Concerns
Still, the bears have ammunition. After a 48% gain over the past year, valuation questions are legitimate. Market commentary is openly asking whether price has gotten ahead of fundamentals — a concern that tends to attract sellers near highs. The daily MACD histogram turning negative while price stalls near the pivot point warns the uptrend may need a deeper reset before resuming.
A break below daily S1 at $213.79 would be a material red flag. That level sits close to the 20-EMA at $216.58, and a close beneath both would shift the daily bias toward neutral at minimum. Below the 50-day EMA at $198.79, the bullish thesis becomes structurally challenged. Meanwhile, the 15m chart already shows price flirting with the lower Bollinger band. If macro headwinds or disappointing deal terms emerge, the path of least resistance could be lower in the short term.
Positioning and Volatility Outlook
Overall, QCOM remains in a daily bullish regime, but the near-term setup is fragile. The cross-timeframe conflict — bullish daily, neutral hourly, weak 15-minute — suggests this is not a moment for aggressive positioning. Daily ATR at $16.87 means meaningful moves can happen quickly, and traders need to respect that volatility.
For now, the stock is in a consolidation phase after a major run. The next decisive move will likely be catalyzed by news flow around the Modular deal or broader semiconductor sentiment. Until the hourly regime shifts back to bullish and the daily MACD histogram turns positive, caution remains the appropriate posture. This holds true even within a structurally constructive trend.
FAQ
Is Qualcomm stock still in a bullish trend?
Yes, Qualcomm stock maintains a structurally bullish posture on the daily chart. Price at $221.90 sits above the 20-day EMA at $216.58, the 50-day EMA at $198.79, and the 200-day EMA at $169.40, confirming a healthy medium-term uptrend. However, short-term momentum is softening, as indicated by the negative daily MACD histogram at -2.43.
What are the key support levels for QCOM?
The nearest dynamic support is the 20-day EMA at $216.58. Below that, daily S1 sits at $213.79. A break beneath these levels would challenge the bullish thesis. The 50-day EMA at $198.79 represents deeper structural support that, if broken, would put the uptrend in question.
What AI catalysts are driving Qualcomm stock?
Bank of America raised its price target on QCOM, citing AI diversification as a key driver. Qualcomm is in advanced talks to acquire Modular Inc., an AI infrastructure software company, in a deal valued at approximately $4 billion. The company is also reportedly in discussions to acquire AI chip startup Tenstorrent, signaling a deliberate pivot beyond mobile chipsets.
Should traders exercise caution on Qualcomm stock right now?
Yes, caution is warranted. The daily MACD histogram is negative at -2.43, the hourly regime is neutral with RSI at 49.36, and the 15-minute chart shows short-term sellers in control. The stock is consolidating after a 48% annual run. The next decisive move likely hinges on deal news flow or broader semiconductor sentiment.
Disclaimer: This article is for informational purposes only and does not constitute financial advice, an investment recommendation, or a solicitation to buy or sell any financial instrument or cryptocurrency. The analysis provided is not indicative of future results. Investing in crypto assets and financial markets carries a high risk of capital loss. Always do your own research (DYOR) and consult a qualified financial advisor before making any decision.
Article produced with the assistance of artificial intelligence and reviewed by the editorial team.


 English (US) ·