
 3 months ago
55
3 months ago
55
- Solana tests key support zone near $80–$85 after reaching target levels
- Break above $85–$86 needed to confirm potential local bottom
- Failure to bounce could push price toward lower support levels
Solana is sitting at a pretty important level right now, hovering near what looks like a short-term support zone after hitting its recent target on the 4-hour chart. Price has drifted into this area quietly, almost like it’s waiting for a reaction, but so far, that reaction hasn’t really shown up. Around $82–$83, things feel a bit… undecided. Buyers are there, maybe, but not aggressive enough yet to flip the mood.
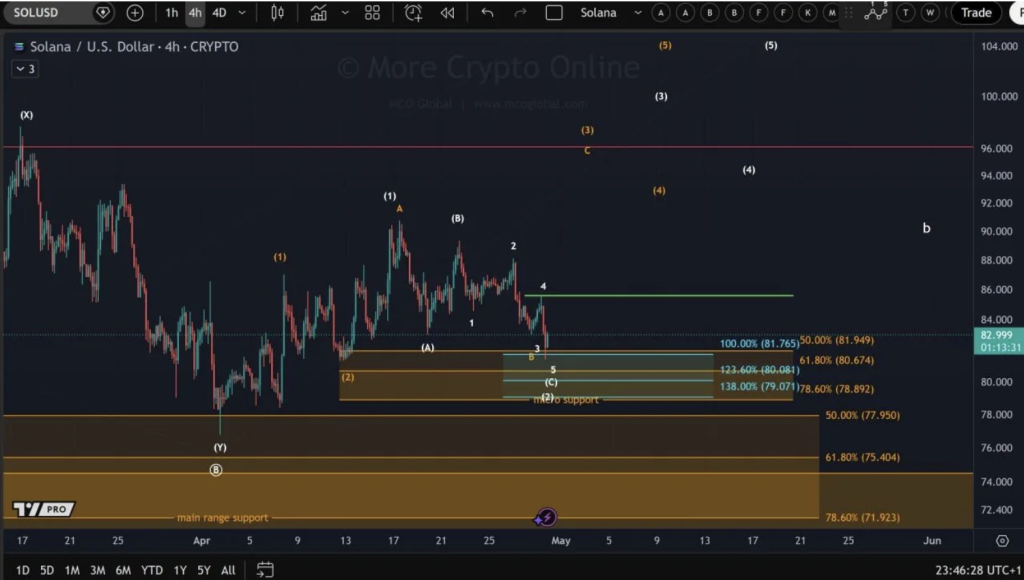
Target Zone Reached but Confirmation Still Missing
According to recent chart analysis, SOL has already tapped into a defined target zone, roughly between $81.7 and $79.0, which lines up with several Fibonacci levels stacked together. That kind of confluence usually matters, it often acts as a place where price pauses, or at least tries to. But just reaching support doesn’t mean much on its own, the real signal comes from how price reacts afterward.
Right now, the key level to watch sits slightly above, around $85.5 to $86. If SOL can push through that green signal line with strength, it could suggest that a local bottom has formed. Without that move, though, the structure still leans corrective, not quite bearish, but definitely not bullish either.
Downside Risk Remains if Bounce Fails
If buyers don’t step in soon, the downside levels start to come into play again. There’s support around $78.9 and $77.9, and below that, a wider range stretches down toward $75 and even $71.9. It’s not an immediate collapse scenario, but the risk is there, especially if momentum continues to fade.
At the moment, price is sitting in that awkward middle ground, where support exists, but confidence doesn’t fully match it. And in markets like this, hesitation can sometimes be enough to tip things lower.
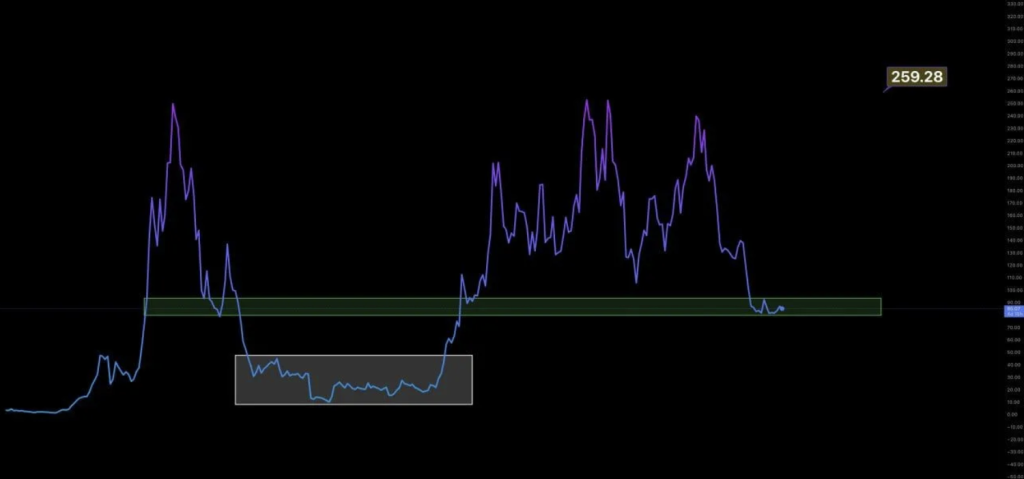
“Great Wall of SOL” Becomes Critical Zone
On a broader view, another chart highlights what’s being called the “Great Wall of SOL,” a wide support band around the mid-$80 region. It’s a level that’s held before, and now price is back there again, moving sideways after a fairly sharp drop from higher levels. That sideways movement can mean accumulation… or just a pause, it’s not always clear right away.
What makes this zone interesting is that SOL previously spent a long time consolidating below similar levels before eventually breaking higher. So there’s a bit of history here, something traders are definitely keeping in mind.
Buyers Need to Prove Strength for Recovery
Still, none of this confirms a reversal just yet. For that, SOL needs a stronger push away from this support area, something that shows buyers are actually in control again, not just reacting passively. Without that, the structure stays fragile, even if it doesn’t break immediately.
If the support holds and momentum builds, this could turn into a base for recovery. But if it fails, the broader trend could weaken further, and the next leg down might come quicker than expected. For now, it’s a waiting game, and the next move probably won’t stay quiet for long.
Disclaimer: BlockNews provides independent reporting on crypto, blockchain, and digital finance. All content is for informational purposes only and does not constitute financial advice. Readers should do their own research before making investment decisions. Some articles may use AI tools to assist in drafting, but every piece is reviewed and edited by our editorial team of experienced crypto writers and analysts before publication.


 English (US) ·