
 2 hours ago
17
2 hours ago
17

Super Micro Computer, Inc. stock closed at $31.13 on 7 August, reclaiming short-term momentum after opening at $29.94. Volume of 32.25 million shares backed the move. Yet the 200-day EMA at $33.04 still caps the market. The base case: neutral-to-constructive structure inside an unresolved downtrend.
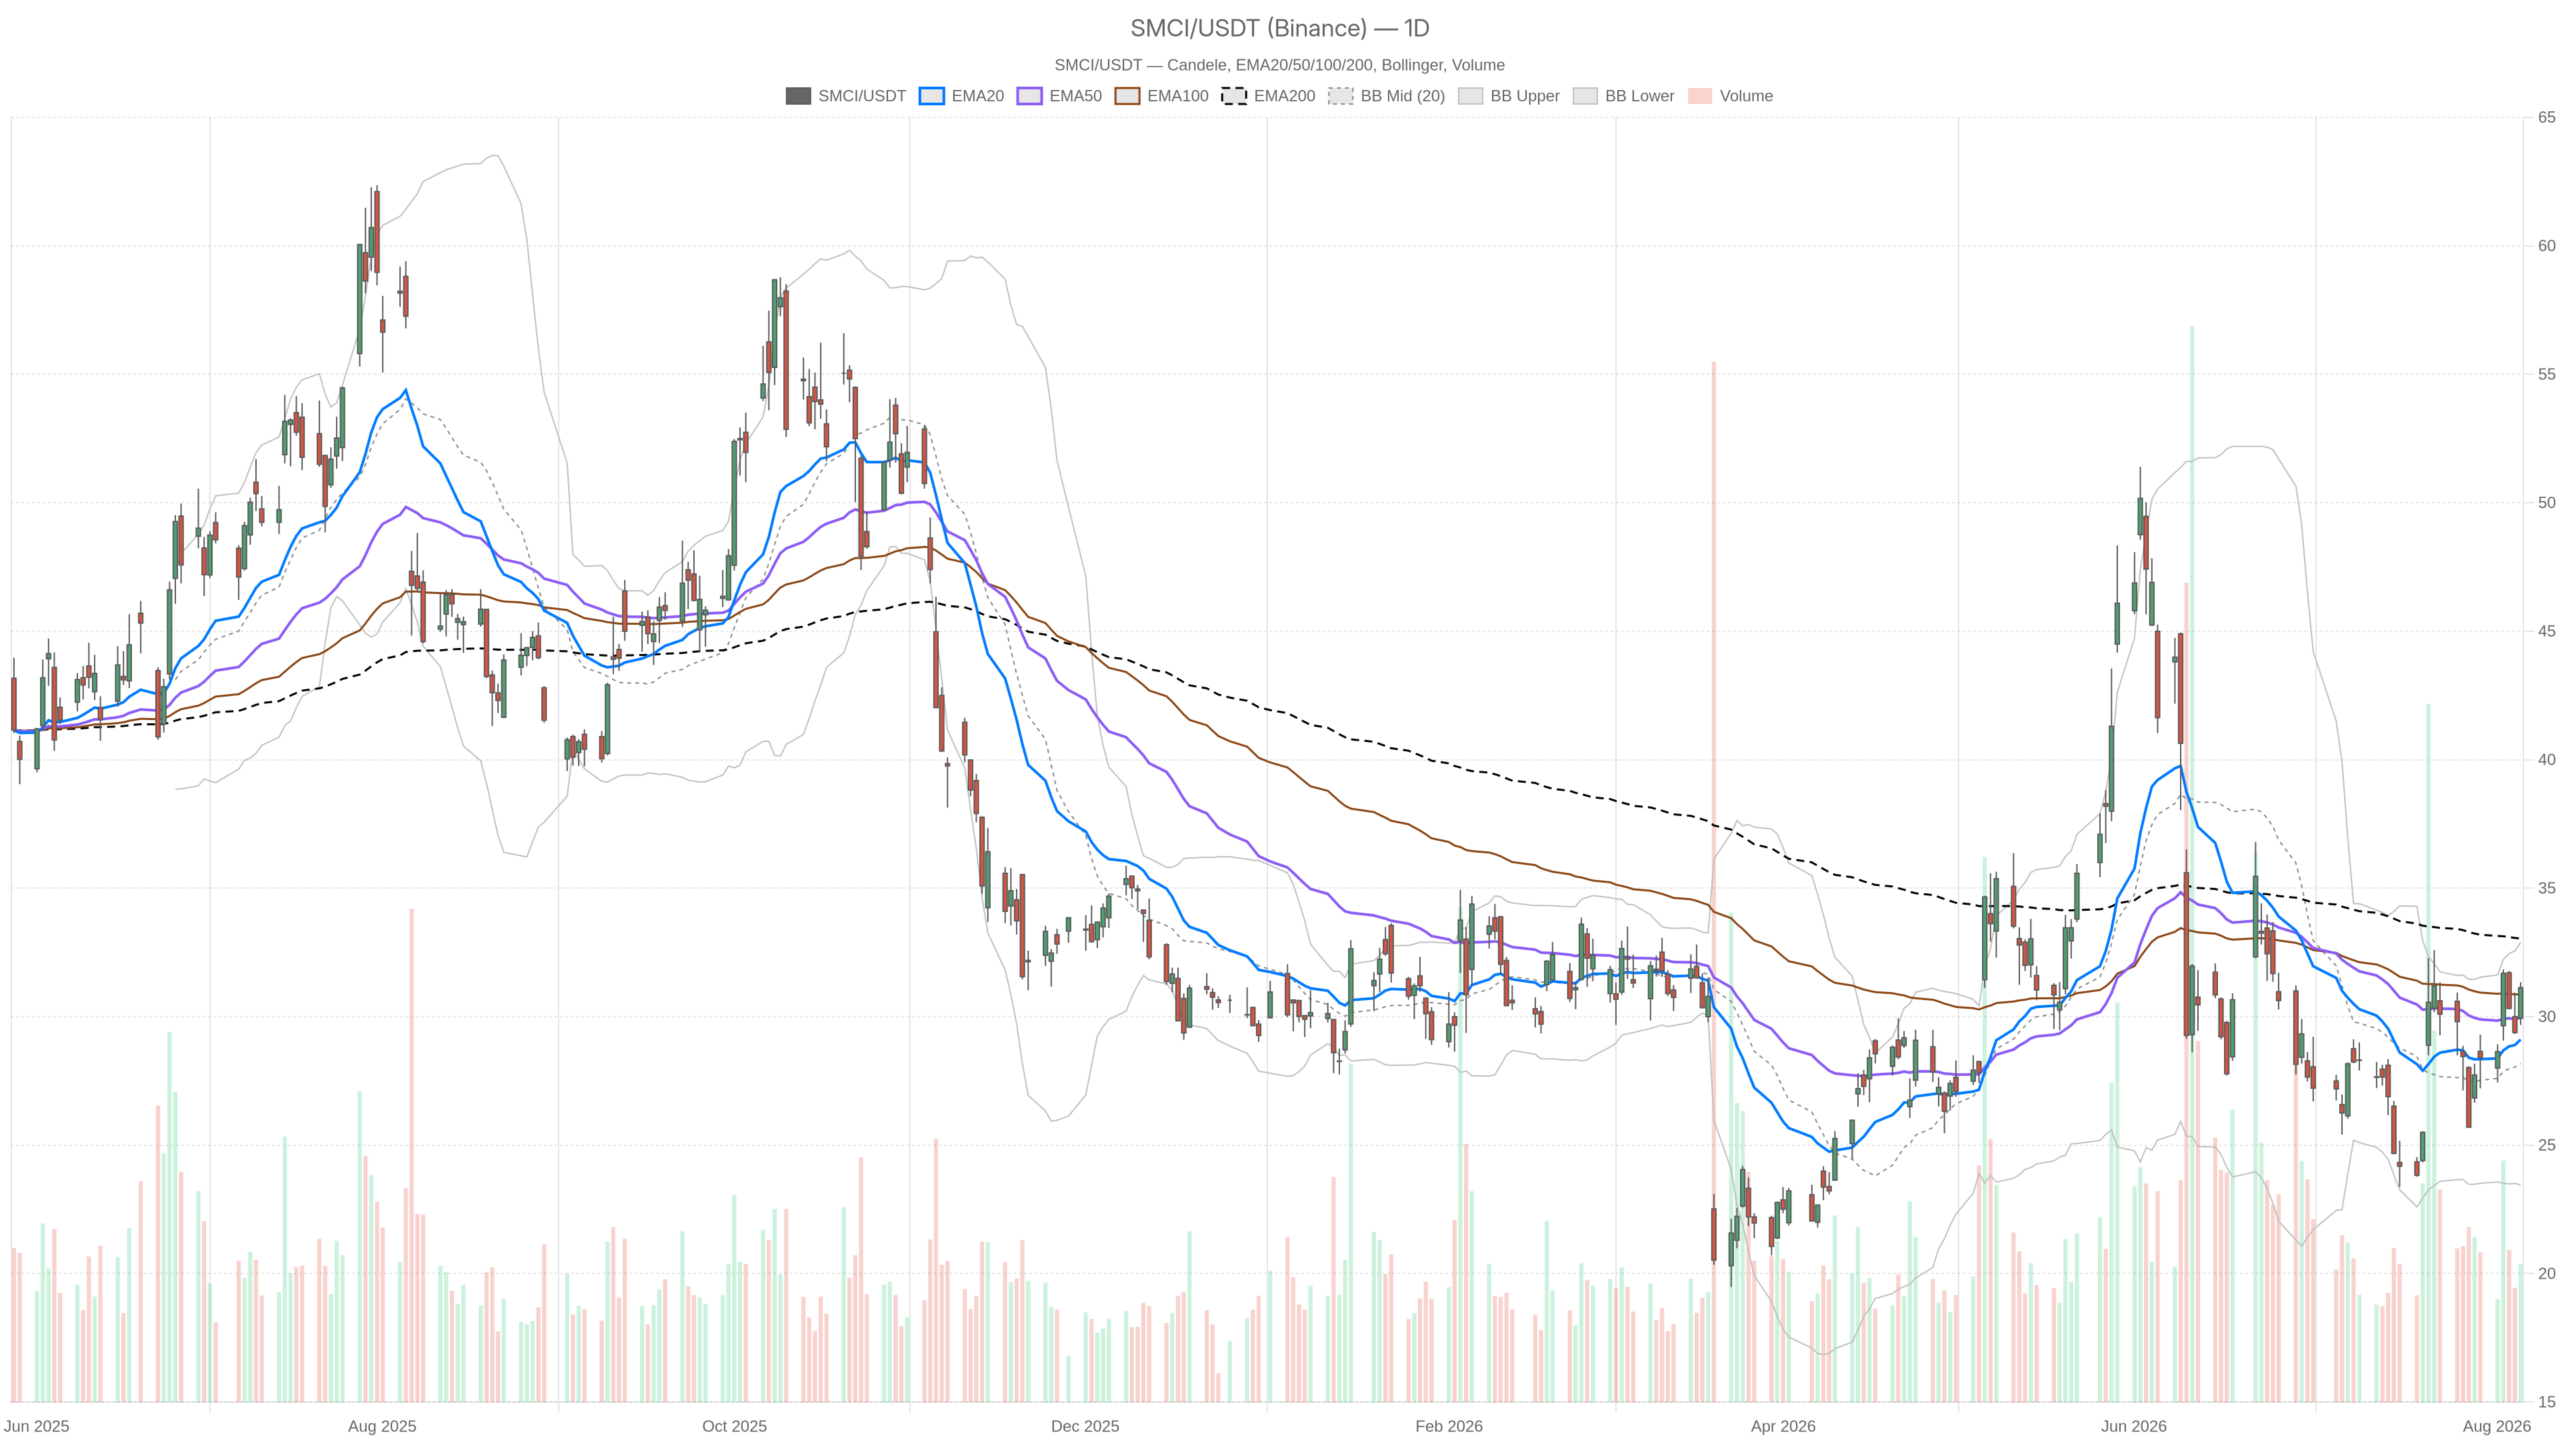 SMCI — daily chart with candlesticks, EMA20/EMA50 and volume.
Key takeaways
- SMCI closed at $31.13 on 7 August with 32.25 million shares traded, reclaiming short-term momentum from a low base.
- Daily RSI at 54.88 is mildly positive; the MACD shows a fresh bullish cross emerging from negative territory.
- The 200-day EMA at $33.04 remains the critical line separating a bounce from a genuine trend change.
- Daily Bollinger Bands are wide ($23.45–$32.90), signalling the mean-reversion move is largely complete.
- Daily ATR of $2.51 implies roughly 8% daily swings, making position sizing more important than entry precision.
Daily structure: Super Micro Computer, Inc. stock recovers under a heavy ceiling
The daily chart places Super Micro Computer, Inc. stock in a recovery attempt that has yet to clear its most important resistance — the 200-day EMA at $33.04.
EMA stack signals progress, but not confirmation
Price at $31.13 sits above both the 20-day EMA at $29.11 and the 50-day EMA at $29.96. That signals short- and medium-term recovery. However, the 20-day EMA remains below the 50-day. The medium-term structure has not fully repaired. Meanwhile, the 200-day EMA at $33.04 is the line that separates a bounce from a trend change.
Momentum and volatility frame the next move
Daily RSI at 54.88 is mildly positive and far from overbought. There is room to extend, but no blow-off signal. Meanwhile, the MACD has just crossed to the upside. The line reads 0.08 against a signal at -0.45, with a histogram of 0.54. This fresh bullish cross from negative territory marks the early stage of a recovery, not a mature trend.
Bollinger Bands are extremely wide, spanning $23.45 to $32.90 around a $28.18 midline. Price has travelled from the lower half to just under the upper band. In other words, the easy part of the mean-reversion move is largely done. Pushing through $32.90 would require fresh demand, not just a relief bid.
Daily ATR of $2.51 quantifies the risk. On a $31 stock, that implies a normal daily swing of roughly 8%. Position sizing matters far more than entry precision here. Pivot levels frame the immediate battlefield: pivot at $30.72, resistance at $31.75, support at $30.09.
The 1H chart confirms the bid in Super Micro Computer, Inc. stock
The hourly chart reads bullish on Super Micro Computer, Inc. stock, with all three key EMAs aligned beneath price and in the correct order for an uptrend.
EMA alignment and momentum on the 1H
The 1H close of $31.10 sits above the 20-period EMA at $30.51. It also clears the 50-period at $29.88 and the 200-period at $29.74. All three are stacked beneath price in the correct order for an uptrend. This confirms the daily bounce from an intraday perspective.
Hourly RSI at 59.82 leans bullish while leaving headroom. At the same time, the hourly MACD is flattening: line 0.29, signal 0.27, histogram just 0.02. Momentum is positive but decelerating. This is consolidation, not fresh acceleration.
Bands and pivots point to compression
Bollinger Bands on the 1H reinforce that reading. Price is pressed against the upper band at $31.66. The midline sits at $30.60. Hourly ATR of $0.60 is modest relative to the daily range. This suggests the market is digesting the move rather than trending through it.
Meanwhile, hourly pivots are tight: pivot $31.06, R1 $31.22, S1 $30.94. This compression zone usually resolves with a directional break. Therefore, the conflict is specific and manageable. The 1H is bullish. The daily is neutral. The disagreement comes down to one level: $33.04. Until it clears, the intraday uptrend is best understood as a counter-trend advance inside an unresolved daily range.
15-minute execution context
The 15-minute chart echoes the hourly picture — constructive but losing thrust, with price pinned inside an exceptionally narrow range.
Price at $31.10 sits above the 20-, 50-, and 200-period EMAs at $30.84, $30.60, and $30.03 respectively. RSI at 59.64 and a MACD histogram of 0.02 mirror the hourly: positive but decelerating.
Notably, price sits exactly on the 15-minute Bollinger midline’s upper structure at $30.84. Bands span $30.30 to $31.38. ATR of $0.21 is very tight. Micro-pivots at $31.11, $31.17, and $31.04 show how narrow the balance area has become. As a result, short-term traders are effectively pinned inside a range of a few cents.
Bullish scenario for Super Micro Computer, Inc. stock
The bullish case requires a clean break above $33.04 to flip the daily regime from neutral to constructive — and a narrative exists to support that outcome.
The bullish scenario needs acceptance above daily R1 at $31.75. After that, an assault on the upper Bollinger band at $32.90. Then the 200-day EMA at $33.04. Clearing that cluster would flip the daily regime to genuinely constructive. It would also convert the 20-day and 50-day EMAs into a support shelf.
Fundamentally, there is a narrative to support the move. Coverage points to $60 billion in orders booked last quarter while shares trade near $30. Notably, one sell-side view frames the stock as a bargain into Q4 earnings. The thesis cites robust demand, margin expansion, and a valuation near multiyear lows.
Meanwhile, the recent 6.0% advance was tied to new high-density, liquid-cooled AI data centre racks. These are built for rapid rack-scale deployment. An AMD Instinct Coder role was also cited. Additionally, the company declared a cash dividend of US$14.7778 per share on its 7.00% Series A Mandatory Convertible Preferred Stock. Overall, the one-month gain of 11.9% aligns with that improving tape. Momentum is being rebuilt from a low base.
Bearish scenario
The bearish case is simpler — the bounce fails at the $32.90–$33.04 resistance zone, and the daily neutral regime resolves lower.
A rejection at the $32.90–$33.04 zone would put the structure back on the defensive. Combined with a loss of the daily pivot at $30.72, the damage would deepen. Furthermore, a break below daily S1 at $30.09 would be more damaging. Below that, the 50-day EMA at $29.96 and the 20-day at $29.11 become the next tests. Losing both would invalidate the recovery thesis outright.
On the hourly chart, a close back under the $30.60 midline would be the first warning. A slip beneath the 1H 200-period EMA at $29.74 would signal the intraday uptrend has broken. The daily neutral regime would then be resolving lower.
In contrast to the constructive headlines, the risk narrative is not trivial. Reporting cites concerns over order quality, stock dilution, and ongoing investigations. These factors keep the shares under pressure. At the same time, delayed deployment conversions and margin pressure are flagged into Q4 fiscal 2026 results. Ultimately, the 37% decline over the past year is a reminder that this remains a repair story, not an established uptrend.
Positioning and closing view on Super Micro Computer, Inc. stock
Super Micro Computer, Inc. stock trades at the top of a wide daily range, with mixed signals — intraday timeframes are bullish, the daily picture remains undecided, and the 200-day EMA at $33.04 is the deciding line.
The signals are mixed by design. Momentum is improving. Yet the dominant trend marker at $33.04 has not been reclaimed. Both facts are true at the same time.
Meanwhile, volatility is the dominant practical consideration. A daily ATR of $2.51 against a $31 price means a single session can erase or extend the entire setup. Compressed intraday ranges near $31.10 suggest a break is close. They do not indicate direction. Add earnings-related uncertainty and the outcome distribution widens further.
For now, the levels that matter are clear. On the upside: $31.75 and $32.90–$33.04. On the downside: $30.72, $30.09, and $29.96. The market will decide which side it wants.
FAQ
Is Super Micro Computer, Inc. stock in an uptrend or a downtrend?
The daily chart is neutral. Price has reclaimed the 20-day and 50-day EMAs, but the 200-day EMA at $33.04 still caps the market. The broader downtrend remains intact until that level is cleared.
What are the key resistance levels for SMCI?
Immediate resistance sits at $31.75 (daily R1), followed by the upper Bollinger band at $32.90. The critical resistance is the 200-day EMA at $33.04. Clearing this would flip the daily regime from neutral to constructive.
What does the daily ATR of $2.51 mean for traders?
On a $31 stock, a daily ATR of $2.51 implies normal daily swings of roughly 8%. This makes position sizing far more important than entry precision in the current environment.
What scenario would invalidate the recovery in SMCI?
A rejection at the $32.90–$33.04 zone followed by a loss of $30.72 and then $30.09 would put the structure back on the defensive. Losing the 20-day and 50-day EMAs at $29.11 and $29.96 would invalidate the recovery outright.
Disclaimer: This article is for informational purposes only and does not constitute financial advice, an investment recommendation, or a solicitation to buy or sell any financial instrument or cryptocurrency. The analysis provided is not indicative of future results. Investing in crypto assets and financial markets carries a high risk of capital loss. Always do your own research (DYOR) and consult a qualified financial advisor before making any decision.
Article produced with the assistance of artificial intelligence and reviewed by the editorial team.








 English (US) ·