
 2 hours ago
14
2 hours ago
14

Universe Pharmaceuticals Inc stock enters August on weak technical footing. At $3.35, UPC sits below all key moving averages, with bearish momentum accelerating across multiple timeframes. Until price reclaims structural resistance, sellers remain in control.
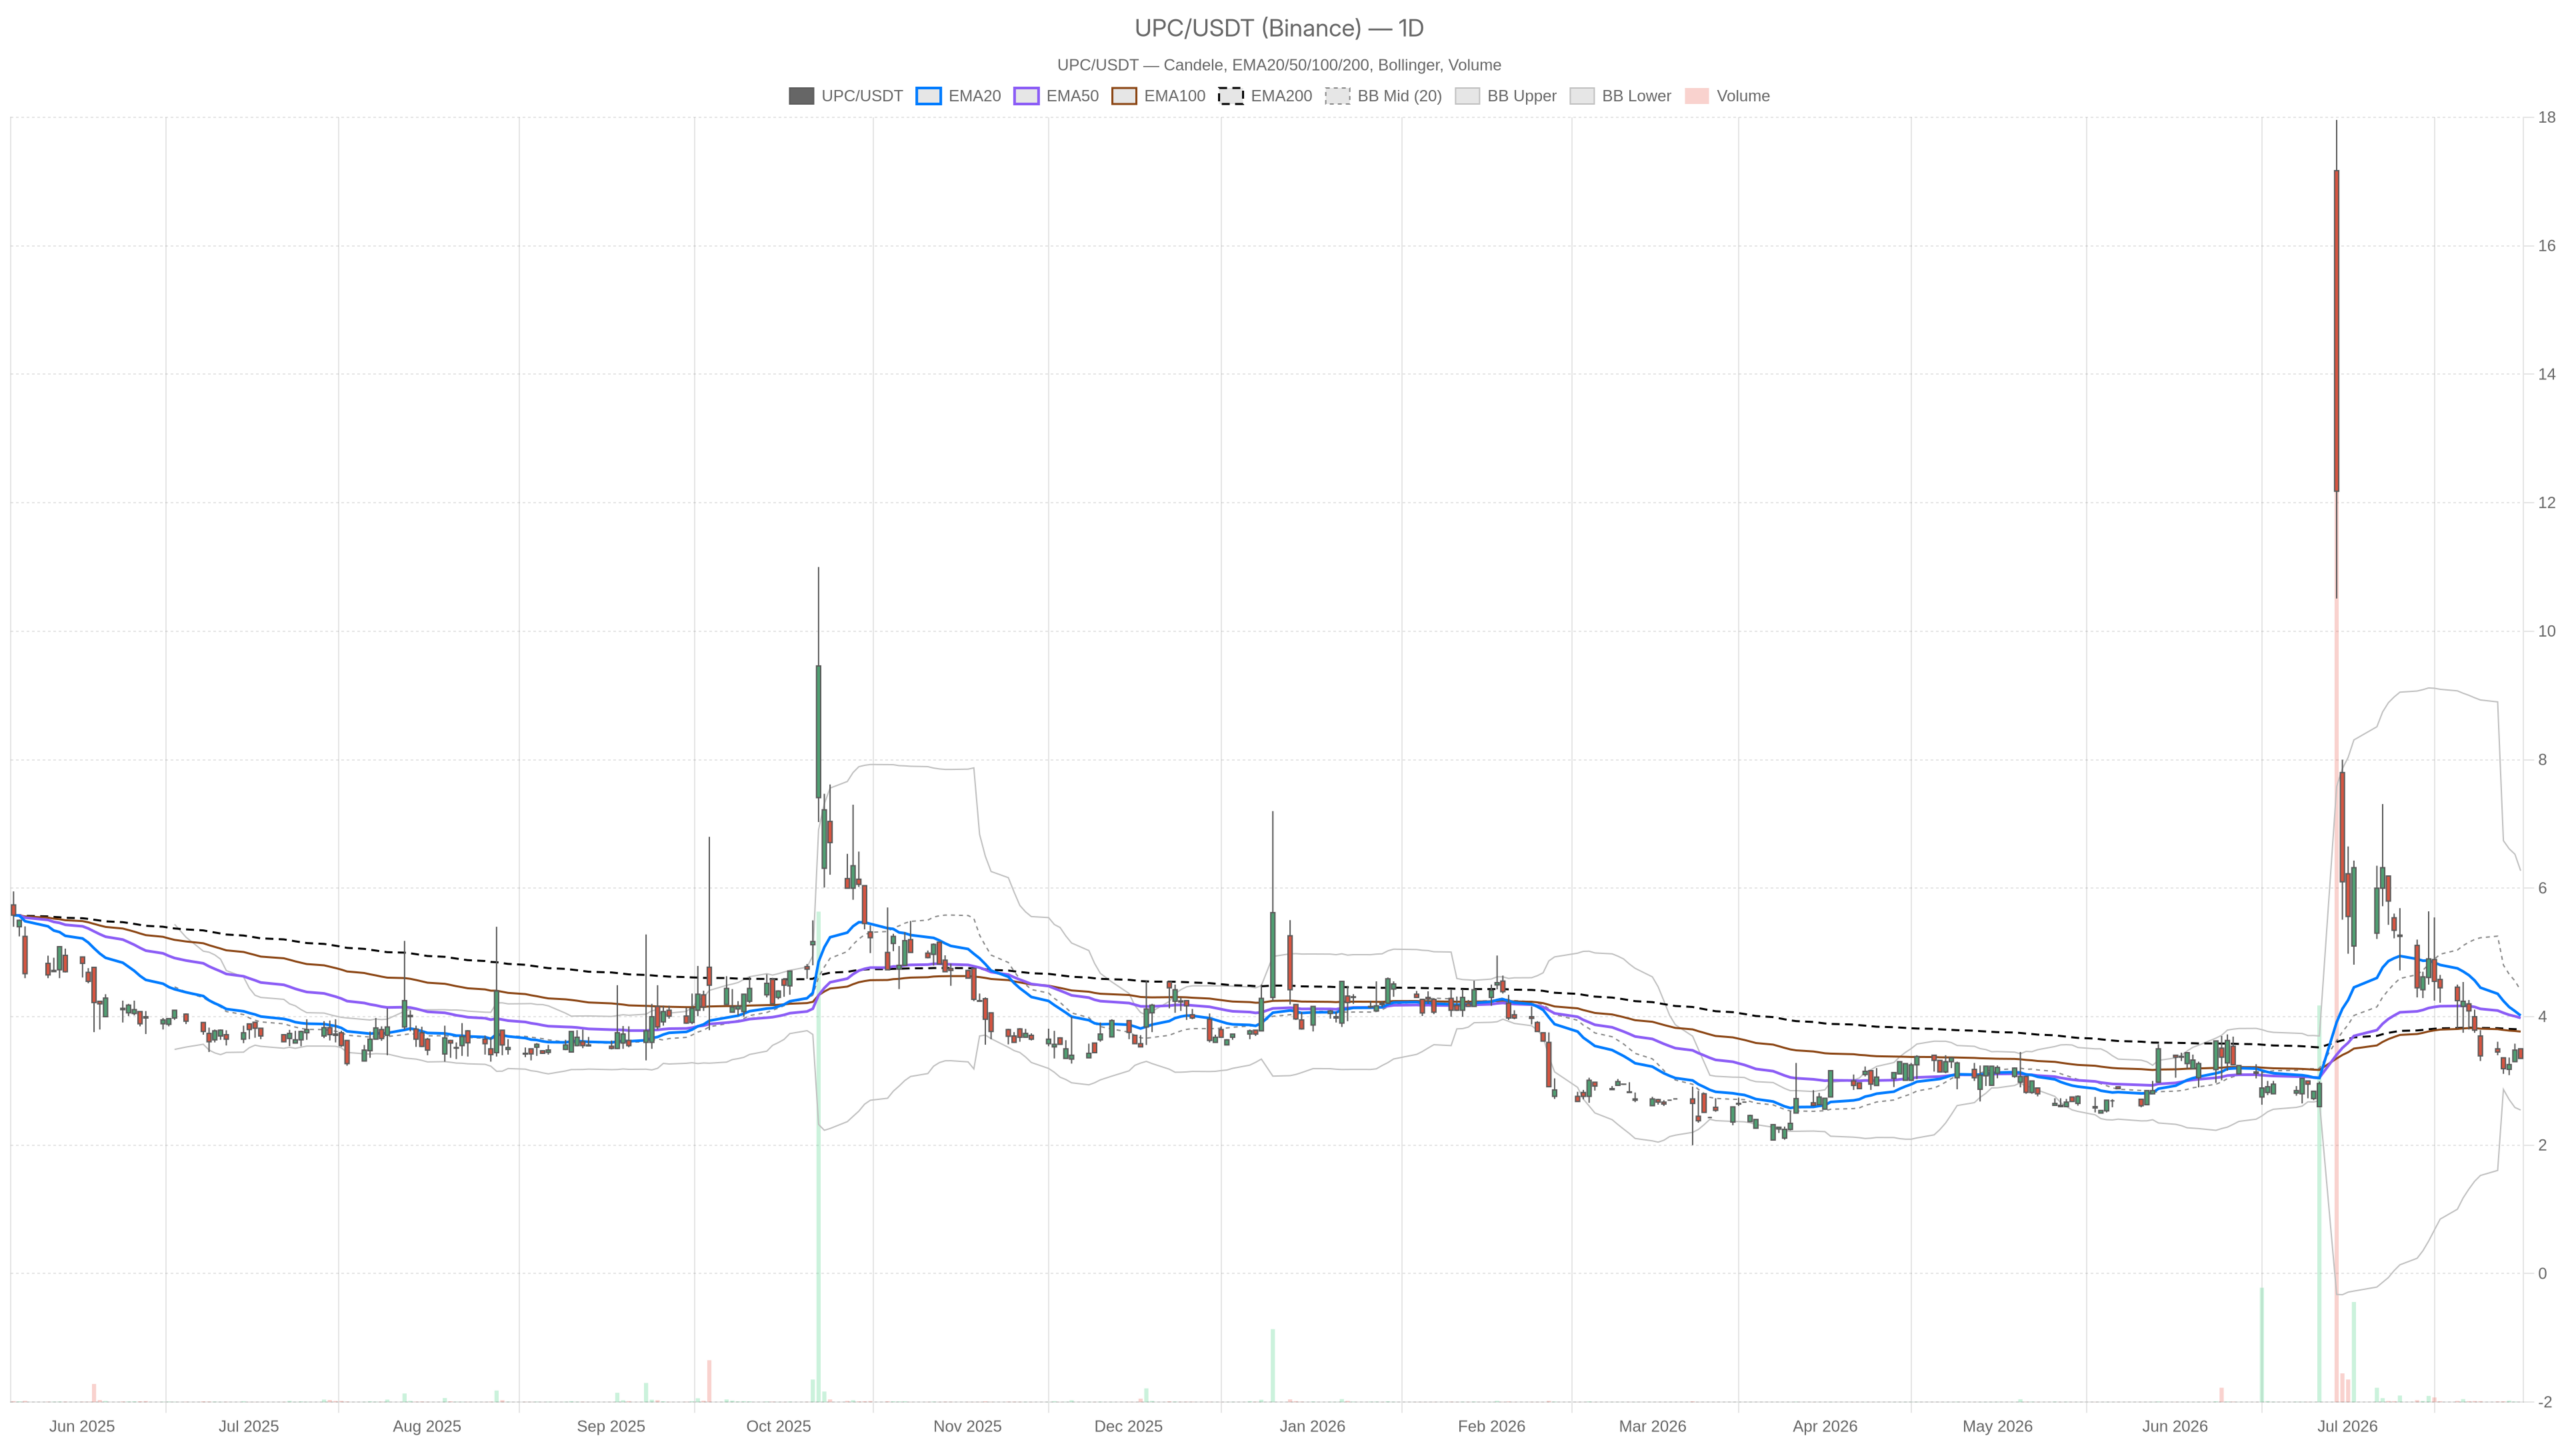 UPC — daily chart with candlesticks, EMA20/EMA50 and volume.
Key takeaways
- UPC closed July at $3.35, trading below its EMA20 ($4.02), EMA50 ($3.98), and EMA200 ($3.80).
- The daily MACD histogram sits at -0.19, signaling accelerating bearish momentum with no signs of deceleration.
- Short-term support sits at $3.25 on the 15-minute chart; a breakdown could open the path toward the $2.55 lower Bollinger Band.
- The daily RSI14 at 43.41 confirms bearish momentum without reaching oversold territory, leaving room for further decline.
- A bullish reversal requires reclaiming the EMA200 at $3.80 — a roughly 13% recovery from current levels.
Daily structure paints a bearish picture for Universe Pharmaceuticals Inc stock
The daily chart leaves little room for ambiguity. Universe Pharmaceuticals Inc stock is under sustained selling pressure, with all major indicators aligned bearishly. Price sits well below every key moving average, while momentum signals point to further downside.
Price action and volume context
The daily candle on July 31 opened at $3.50 and closed at $3.35, with the session’s high capping at exactly the open. When the open acts as the ceiling, it reflects consistent selling throughout the session. Volume at 164 units was light, meaning the move lacked conviction but equally lacked any buying support.
Moving averages and momentum indicators
Notably, all three EMAs are stacked bearishly against price. The EMA20 sits at $4.02, the EMA50 at $3.98, and the EMA200 at $3.80. UPC trades below all three. The EMA200 alone sits $0.45 above the close — a significant structural gap that must be closed before any recovery thesis can be built.
Meanwhile, the daily RSI14 reads 43.41. It has not broken into oversold territory. Yet it sits well below the neutral 50 level, confirming momentum favors sellers without signaling capitulation. In parallel, the MACD tells a similar story: the line is at -0.30, the signal at -0.11, and the histogram at -0.19. The histogram’s negative reading shows bearish momentum is accelerating, not fading.
Volatility bands and pivot analysis
On the volatility front, Bollinger Bands place the daily midline at $4.41, well above current price. The lower band sits at $2.55 and the upper at $6.27. Trading in the lower half of the band range reflects a stock under sustained pressure rather than one consolidating before a breakout.
At the same time, the daily ATR14 is $0.53 — meaningful volatility for a stock in the $3.35 range. This level of swing risk demands respect, particularly given the lack of nearby support structure. Pivot analysis shows the daily pivot point at $3.40, with R1 at $3.45 and S1 at $3.30. The close at $3.35 places price between the pivot and S1. This marginally bearish positioning confirms bulls failed to defend even the baseline reference.
Intraday signals reinforce the bearish bias
The 1H chart reinforces the bearish thesis without offering any conflicting signals. Price action, momentum, and trend structure all align toward continued weakness for Universe Pharmaceuticals Inc stock.
On the 1H chart, price closed at $3.25 by 15:30, with the session high matching the open at $3.27. There was no intraday recovery attempt. The regime on this timeframe is classified as bearish — a direct confirmation of the daily bias rather than a complication of it.
Moreover, the 1H EMA structure reinforces the downtrend clearly. EMA20 is at $3.33, EMA50 at $3.53, and EMA200 at $4.09 — all above current price. The RSI14 on the 1H sits at 43.56, nearly identical to the daily reading. That alignment between timeframes signals consistent, broadening selling pressure rather than isolated short-term noise.
Notably, the 1H MACD histogram reads exactly zero, with both the line and signal at -0.05. This flat reading reflects a brief loss of directional momentum on the hourly — not a bullish reversal, but a pause. In a downtrend, such pauses typically resolve with a continuation lower.
The 1H Bollinger Bands show a midline at $3.32, upper at $3.57, and lower at $3.06. Price near $3.25 is hugging the lower portion of this band. The 1H ATR is $0.10, a tight range suggesting intraday movement has compressed. That compression, in a bearish regime, often precedes continuation rather than reversal.
15-minute chart defines the immediate battlefield
The 15-minute timeframe confirms the bearish regime and identifies the critical $3.25 line as the immediate battleground for UPC. A break below this level would signal short-term acceleration aligning with the broader downtrend.
The EMA20 sits at $3.33, EMA50 at $3.34, and EMA200 at $3.73 — all above price. RSI14 is at 41.29, slightly weaker than the hourly reading. The MACD histogram shows -0.03, with the line at -0.02 crossing below the signal at 0.01. That minor negative crossover on the 15m serves as a short-term execution signal aligned with the broader directional pressure.
On this timeframe, the ATR compresses to just $0.04. The pivot structure shows both PP and R1 at $3.26, with S1 at $3.25. Price at $3.25 sits directly on the S1 level. In the short term, this is the critical line to watch. A clean break below $3.25 would open the door toward the daily S1 at $3.30. That level has already been undermined. The next target sits at the lower Bollinger Band near $2.55 on the daily chart.
The bullish scenario — what must change
A bullish reversal for Universe Pharmaceuticals Inc stock is not impossible, but it demands structural changes not yet visible on the chart. The burden of proof rests squarely with buyers.
In concrete terms, for the thesis to flip, UPC would need to reclaim the daily pivot at $3.40. More importantly, it must push back above the EMA200 at $3.80. That represents a roughly 13% recovery from current levels — achievable, but not likely without a significant catalyst.
From a news perspective, The Motley Fool highlighted three stocks with potential upside by end of 2026 on July 30. Analysts remain optimistic about upcoming catalysts being received bullishly by the market. That sentiment is notable context, though it does not name UPC directly. If the company delivered a positive fundamental catalyst — clinical, regulatory, or financial — the compressed Bollinger Band range could work in bulls’ favor, amplifying any move upward.
In that scenario, the daily RSI at 43.41 has meaningful room to climb before hitting overbought levels. A recovery would not face immediate momentum exhaustion. That is one of the few constructive technical features currently visible on UPC’s chart.
The bearish scenario — what could deepen the decline
The bear case for Universe Pharmaceuticals Inc stock is more directly supported by current data. Momentum, trend structure, and intraday alignment all favor continued downside pressure.
On the downside, a sustained close below $3.25 — the 15m S1 and current price floor — would signal a clean breakdown. The next meaningful daily support sits near $2.55, the lower Bollinger Band. At roughly $0.80 below current levels, this target sits well within the range of the daily ATR of $0.53 playing out over several sessions.
The daily MACD histogram at -0.19 is the most concerning element. It shows that bearish momentum is not decelerating. Combined with a close below all three major EMAs, the technical evidence argues against anticipating a near-term floor without confirming price action.
Furthermore, the daily regime is classified as neutral — not yet fully bearish — while the 1H and 15m both register as bearish. That divergence between timeframes suggests the daily trend is in the process of shifting, not stabilizing. When shorter timeframes lead the regime classification lower, the daily often follows.
Positioning, volatility, and the road ahead
Universe Pharmaceuticals Inc stock enters August with technical conditions overwhelmingly favoring caution over aggression. The multi-timeframe alignment of bearish signals leaves little room for aggressive positioning on the long side.
Overall, the daily structure is bearish by momentum, trend, and volatility metrics alike. Intraday confirmation reinforces rather than challenges that reading. The $3.25–$3.30 zone remains a critical short-term battleground. A decisive break below it likely accelerates selling pressure. Only a recovery above the EMA20 at $4.02 on the daily would shift the structural narrative toward recovery. Until then, the burden of proof rests firmly with bears.
FAQ
Is Universe Pharmaceuticals Inc stock currently in a bearish trend?
The daily chart shows a clear bearish bias. UPC closed at $3.35, well below its EMA20 ($4.02), EMA50 ($3.98), and EMA200 ($3.80). The daily MACD histogram at -0.19 confirms accelerating bearish momentum, while the RSI14 at 43.41 sits below the neutral 50 level, reinforcing downside pressure.
What is the next key support level for UPC stock?
The immediate support sits at $3.25 on the 15-minute chart. A breakdown below this level would expose the daily S1 at $3.30 — which has already been undermined — and ultimately the lower Bollinger Band at $2.55. The daily ATR of $0.53 suggests this move could unfold over multiple sessions.
What would signal a bullish reversal for Universe Pharmaceuticals Inc stock?
A bullish reversal would require UPC to reclaim the daily pivot at $3.40, followed by a push above the EMA200 at $3.80 — a roughly 13% recovery. A positive fundamental catalyst could help drive such a move, aided by the compressed Bollinger Band range amplifying the upside. Until then, the technical structure favors continued caution.
Disclaimer: This article is for informational purposes only and does not constitute financial advice, an investment recommendation, or a solicitation to buy or sell any financial instrument or cryptocurrency. The analysis provided is not indicative of future results. Investing in crypto assets and financial markets carries a high risk of capital loss. Always do your own research (DYOR) and consult a qualified financial advisor before making any decision.
Article produced with the assistance of artificial intelligence and reviewed by the editorial team.









 English (US) ·