
 3 hours ago
22
3 hours ago
22
AAPL stock closed at $315.32 on July 10, holding a firmly bullish structure above all key moving averages. The trend remains intact after a 48.9% one-year rally. Still, price is now pressing the upper Bollinger Band — a level that demands short-term caution.
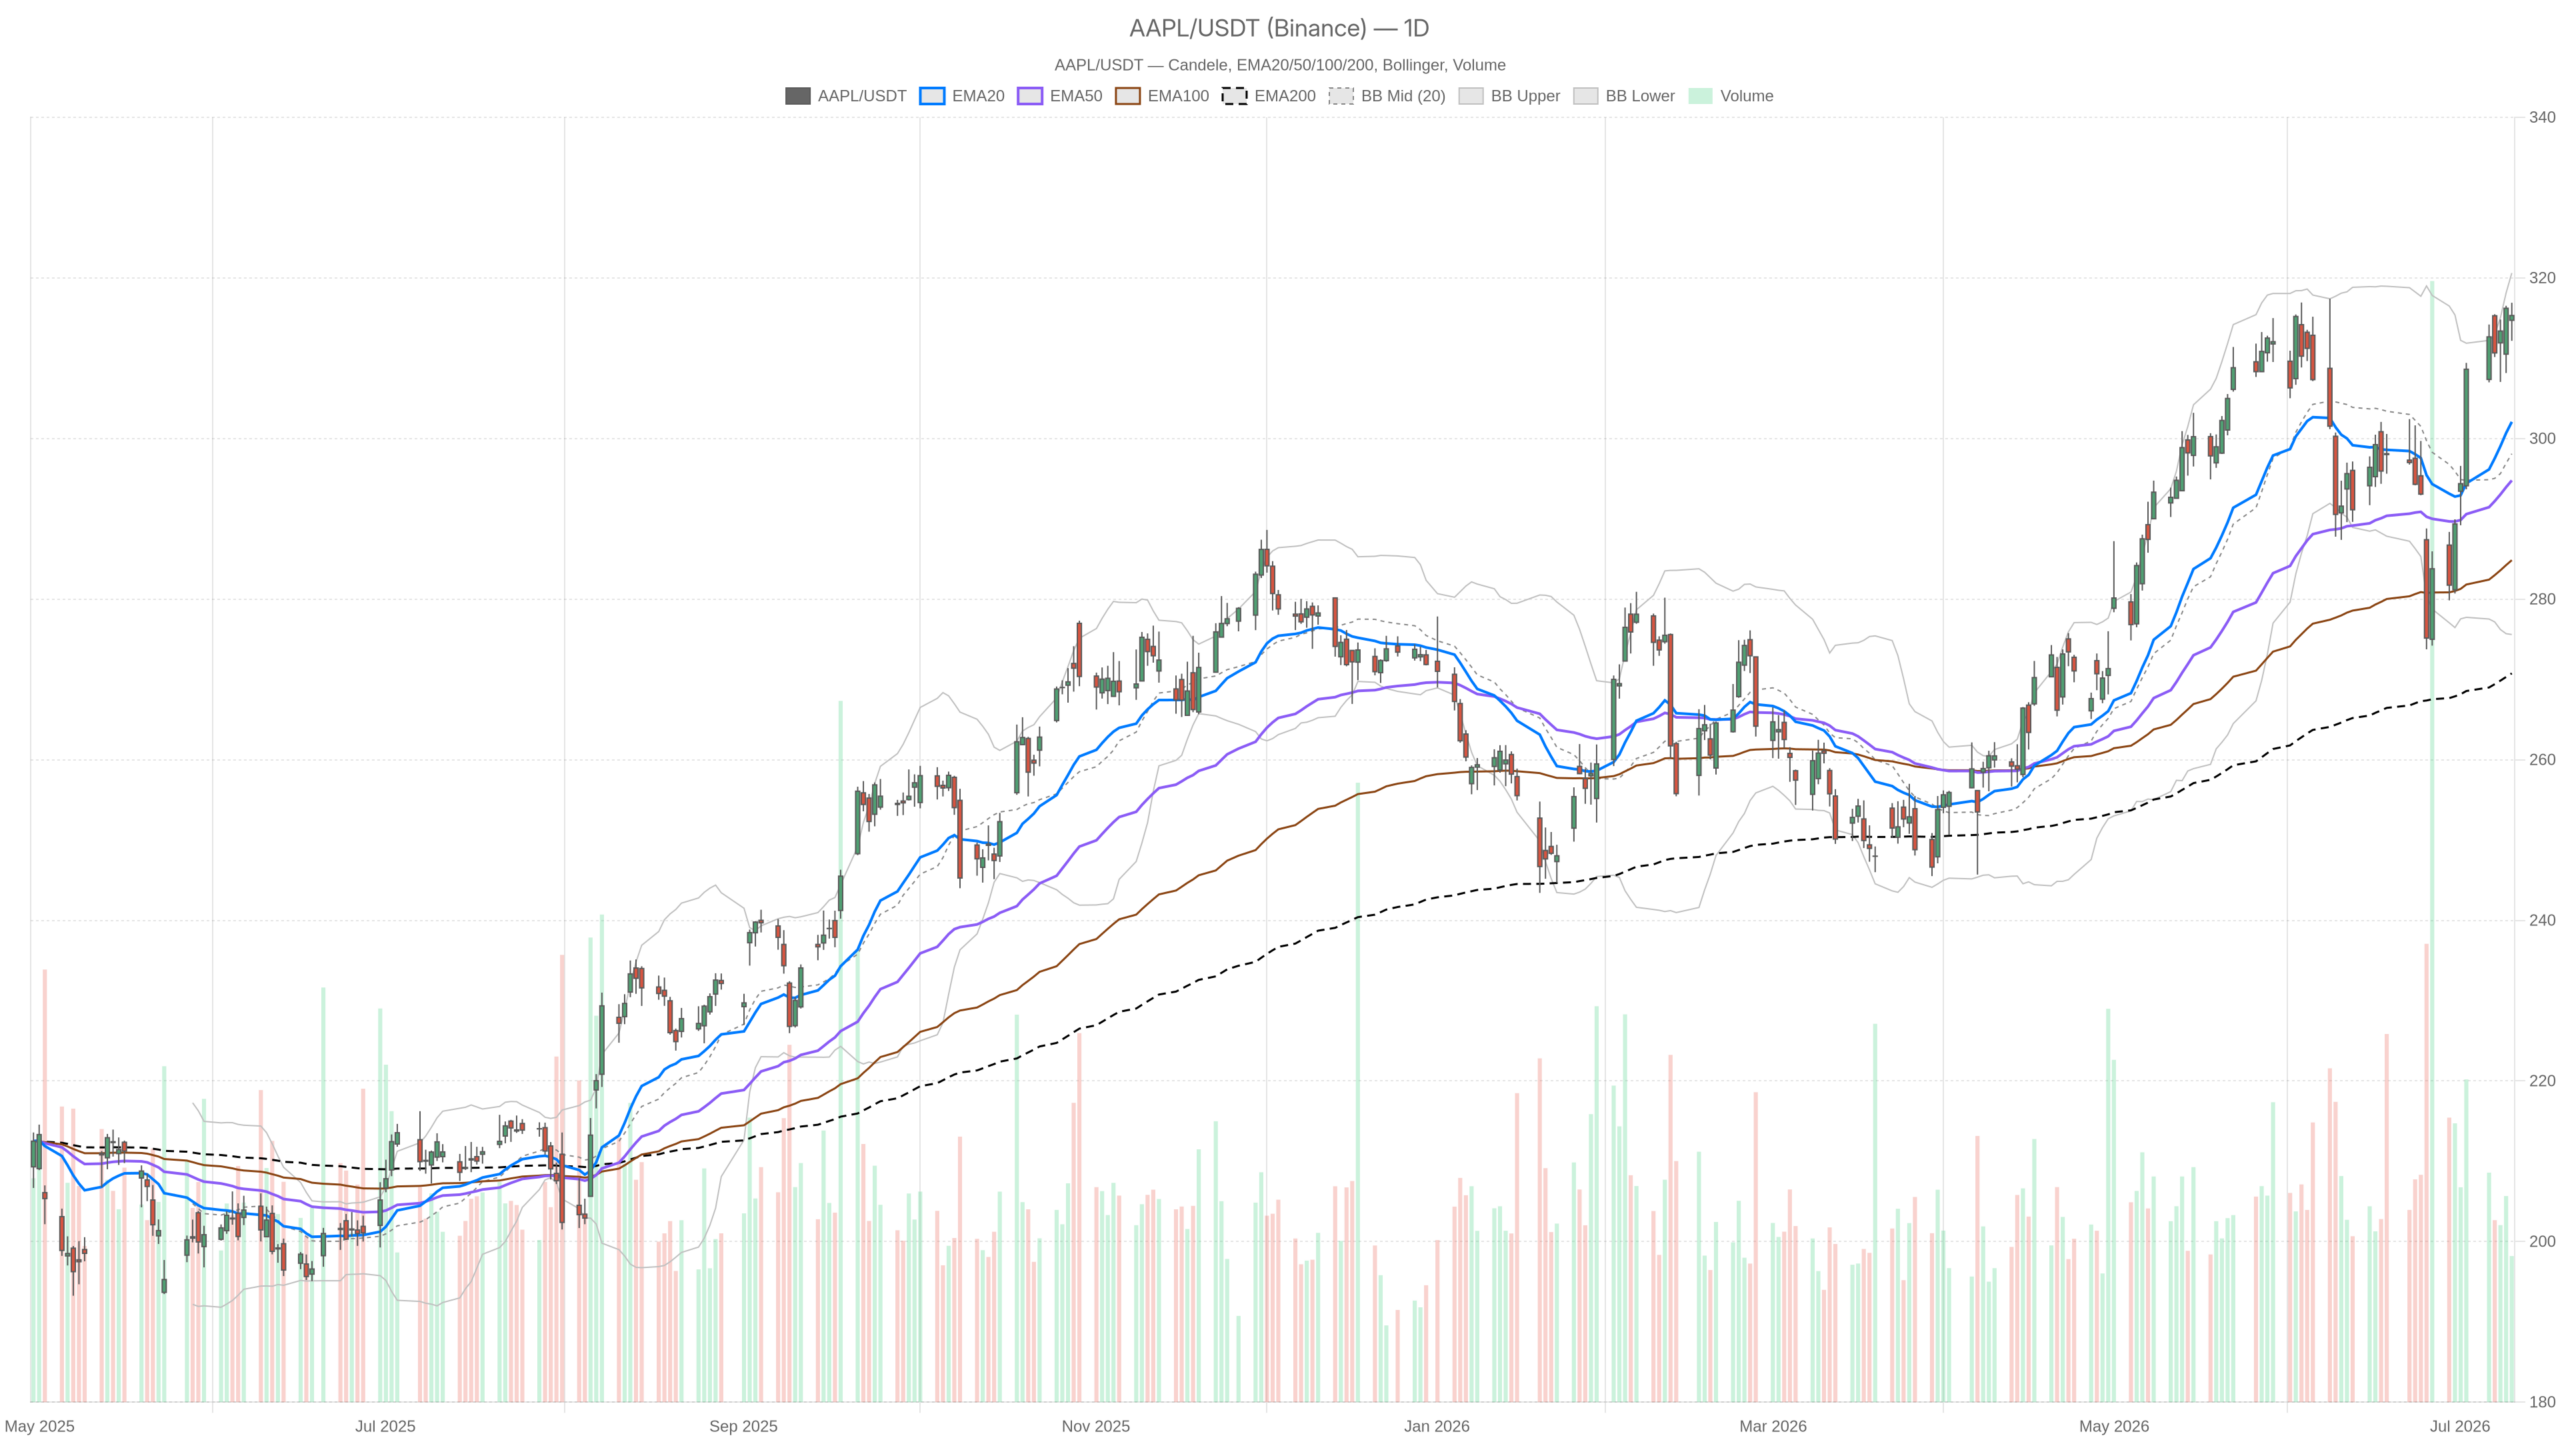 AAPL — daily chart with candlesticks, EMA20/EMA50 and volume.
Key takeaways
- AAPL closed at $315.32 on July 10, up 48.9% over the past year and 16.9% year-to-date.
- The daily EMA stack confirms sustained institutional accumulation, with price well above the EMA200 at $270.76.
- Daily RSI at 62.93 leaves room for further upside before reaching overbought territory.
- The 1H MACD histogram has turned modestly negative at -0.32, signaling fading intraday momentum.
- Apple’s $30 billion Broadcom deal provides a fundamental catalyst, while AI monetization debates introduce uncertainty.
- Evercore ISI maintains a $365 price target — roughly 16% above current levels.
Daily Timeframe: Bullish Regime With a Ceiling Approaching
The daily chart confirms a clean bullish regime with all three major EMAs aligned upward. However, price is now approaching the upper Bollinger Band at $320.61 — where upside becomes structurally harder to sustain.
Notably, all three major EMAs are aligned to the upside. Price trades significantly above the EMA20 at $302.08, EMA50 at $294.78, and EMA200 at $270.76. That separation reflects sustained buying pressure rather than speculative noise.
Momentum Indicators: RSI and MACD Still Constructive
The daily RSI at 62.93 is elevated but not yet at overbought extremes. There is still room to push higher before momentum becomes structurally stretched. Notably, any deterioration below 55 would signal a meaningful cooling in buying conviction.
Meanwhile, the MACD reinforces the bullish case. The line at 4.61 sits well above the signal at 1.89, with a histogram of 2.72. This positive spread confirms momentum has not yet begun to roll over. On this timeframe, there is no divergence to worry about.
Bollinger Bands and Pivot Levels
Meanwhile, the Bollinger Bands add important context. The midline is at $298.10. The upper band sits at $320.61 and the lower at $275.59. At $315.32, Apple trades in the upper half — approaching the ceiling rather than the floor. This does not negate the uptrend. It does suggest the easy gains are already priced in.
In addition, the daily ATR of $8.95 reflects a stock with real intraday range. Any reversal, when it comes, could be sharp. Daily pivot levels place the pivot at $314.80, with R1 at $317.43 and S1 at $312.69. The close of $315.32 lands just above the pivot — constructive, but not a breakout. A push through R1 would be technically significant. A close below S1 on volume would prompt reassessment.
Hourly View: Bullish Bias With a Notable MACD Warning
The 1-hour chart maintains a bullish bias, but the MACD has introduced a modest warning. Intraday momentum is fading even as the broader trend holds.
On this timeframe, price at $315.33 trades above the 1H EMA20 at $313.77, EMA50 at $308.75, and EMA200 at $301.12 — a healthy bullish stack. The 1H RSI at 60.23 is firm. It mirrors the daily picture without signaling any immediate reversal risk.
In contrast, the 1H MACD introduces the first genuine complication. The MACD line at 1.72 has slipped below the signal line at 2.04, producing a histogram reading of -0.32. This modest negative divergence does not negate the daily bias. However, it suggests intraday buying pressure is easing at current levels.
At the same time, the 1H Bollinger Bands confirm near-term tightening. The midline sits at $314.05, with the upper band at $316.97 and lower at $311.12. At $315.33, price is pressing against the upper half of the 1H range. The stock is consolidating near recent highs rather than breaking out. The 1H ATR of $2.04 reflects contained volatility — consistent with a pause, not a breakdown.
Overall, the hourly read does not invalidate the daily bullish thesis. It simply adds a layer of short-term friction that traders should factor into timing decisions.
15-Minute Context: Execution Zone for Dip Buyers
The 15-minute chart offers execution context only, with no directional urgency. It points to a controlled, low-volatility consolidation.
The 15m price at $315.33 sits above EMA20 at $314.92 and EMA50 at $314.23, maintaining micro-trend support. The 15m RSI at 55.11 is neutral — not overbought, not oversold. The MACD histogram at 0.18 is marginally positive. There is no signal demanding urgency in either direction.
This is a controlled consolidation after the session’s intraday range. For those looking to enter long, the 15m pivot support at $314.48 and S1 at $314.48 offer a natural first reference for stop placement.
AAPL Stock Catalyst Watch: The $30 Billion Broadcom Deal and the AI Debate
Notably, technicals do not exist in isolation. Apple’s $30 billion Broadcom deal and the ongoing AI monetization debate provide the fundamental backdrop.
CEO Tim Cook recently announced the deal to produce 15 billion chips under the American Manufacturing Program. This is a meaningful strategic commitment — signaling long-term supply chain investment. Such moves tend to resonate with institutional holders.
At the same time, the AI monetization narrative faces growing scrutiny. The idea of Apple as an AI toll booth — collecting fees from every interaction on its devices — is being questioned. Rising iPhone costs are flagged as a potential growth headwind. This tension between strategic spending and monetization uncertainty is worth monitoring.
Notably, Evercore ISI maintained coverage on June 25 with a $365 price target — roughly 16% above current levels. D.E. Shaw counts AAPL among its top holdings. Institutional conviction remains visible. However, the debate over whether Apple can translate AI infrastructure into genuine revenue growth is far from settled.
Bullish Scenario for AAPL Stock
The bullish setup remains favorable as long as AAPL holds above the daily pivot at $314.80. A break above R1 at $317.43 would confirm resolution to the upside.
A clean push through daily R1, accompanied by a recovery in the 1H MACD histogram, would confirm the intraday friction has resolved bullishly. In that scenario, the daily Bollinger upper band at $320.61 becomes the next natural target. The Broadcom chip deal provides a fresh fundamental narrative for that leg higher. Meanwhile, institutional holders like D.E. Shaw give the stock structural demand support that limits downside during normal consolidations.
Bearish Scenario for AAPL Stock
A failure to reclaim $316 intraday and a close below daily S1 at $312.69 would shift the near-term tone considerably. That is where momentum buyers would reassess exposure.
A deteriorating 1H MACD with a deepening negative histogram, combined with daily RSI softening through 50, would constitute a more serious warning. The AI monetization concern — rising iPhone costs meeting weak AI revenue — represents the fundamental risk that could accelerate any technical breakdown.
The daily ATR of $8.95 means a one or two standard deviation move lower would quickly bring the $302–$298 EMA cluster into play. That cluster forms the line in the sand for the broader bullish thesis.
Positioning Into Uncertainty for AAPL Stock
AAPL’s technical structure remains one of the strongest among large-cap equities. However, the current price level — pressing the upper Bollinger Band with a fading 1H MACD — is not an easy entry point.
The daily trend is clean, momentum is constructive, and institutional interest is clearly present. Nevertheless, the risk-reward profile is less attractive than it was at lower levels. Volatility is contained for now, but the daily ATR of $8.95 is a reminder that conditions can shift quickly.
In short, patience on timing, rather than chasing current levels, is the more defensible approach. The trend is a friend — until it is not.
FAQ
Is AAPL stock still in a bullish trend?
AAPL remains in a firmly bullish trend. The daily chart shows price well above all three major EMAs — EMA20 at $302.08, EMA50 at $294.78, and EMA200 at $270.76. This alignment confirms sustained institutional accumulation. Shares are up 48.9% over the past year.
What is the key risk for AAPL stock right now?
The primary near-term risk is that AAPL is pressing the upper Bollinger Band at $320.61 while the 1H MACD histogram has turned negative at -0.32. This combination suggests fading intraday momentum at elevated levels, making risk-reward less attractive for new entries.
What are analysts saying about Apple’s AI strategy?
Evercore ISI maintains a $365 price target — roughly 16% above current levels. However, some analysts question whether Apple can monetize AI effectively, flagging rising iPhone costs as a potential headwind. The debate remains unsettled.
What price levels should AAPL traders watch?
Key levels include the daily pivot at $314.80, R1 resistance at $317.43, and S1 support at $312.69. A break above R1 would confirm bullish continuation toward the upper Bollinger Band at $320.61. A close below S1 would shift the near-term tone bearish.
Disclaimer: This article is for informational purposes only and does not constitute financial advice, an investment recommendation, or a solicitation to buy or sell any financial instrument or cryptocurrency. The analysis provided is not indicative of future results. Investing in crypto assets and financial markets carries a high risk of capital loss. Always do your own research (DYOR) and consult a qualified financial advisor before making any decision.
Article produced with the assistance of artificial intelligence and reviewed by the editorial team.








 English (US) ·