
 3 hours ago
10
3 hours ago
10
Advance Auto Parts Inc. stock cratered after a disappointing earnings report missed revenue forecasts. Shares closed at $43.70 on August 20, 2026, following a premarket drop exceeding 15%. The gap-and-crash session left the stock deeply oversold across all timeframes.
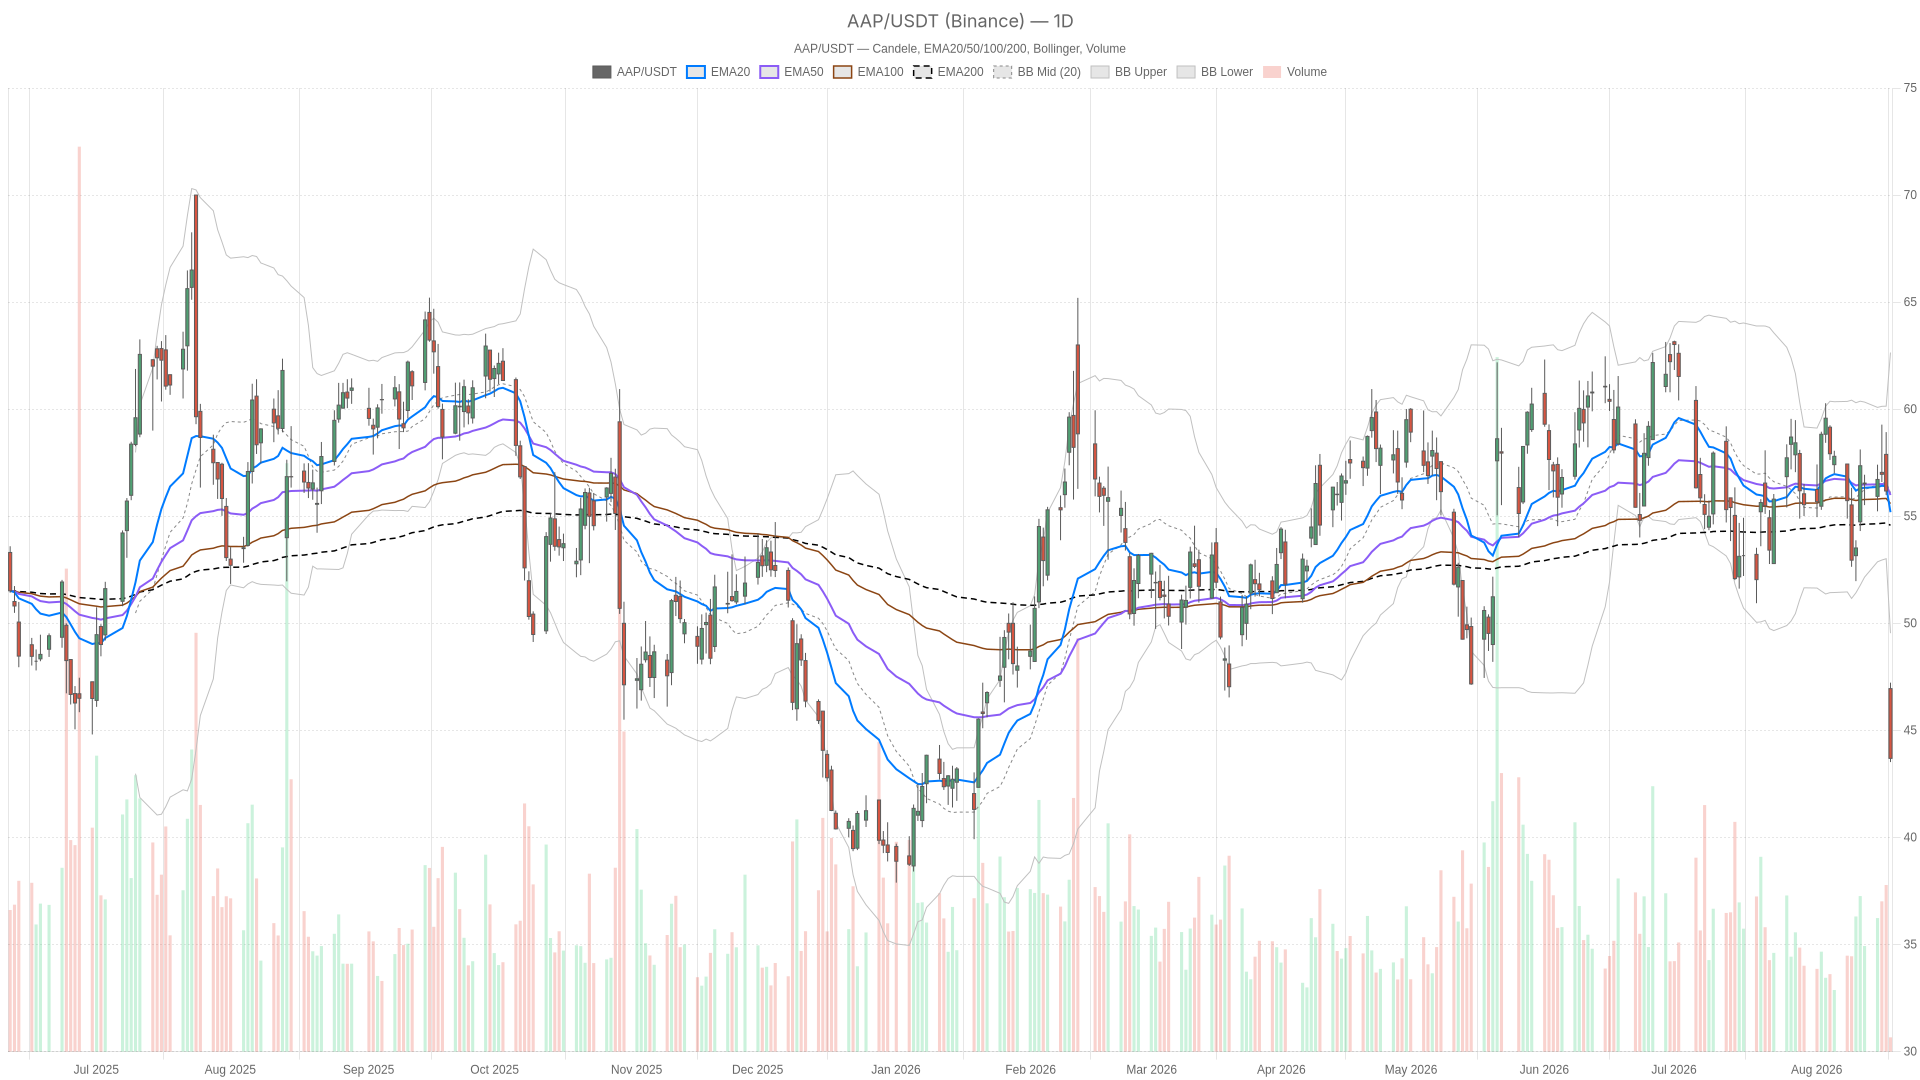 AAP — daily chart with candlesticks, EMA20/EMA50 and volume.
Key takeaways
- Advance Auto Parts Inc. stock closed at $43.70, down from an open of $46.95 after missing revenue forecasts.
- The daily RSI14 dropped to 28.71, with MACD widening to -1.09 against a -0.31 signal line.
- Price broke below the daily lower Bollinger Band at $49.54 and every major moving average.
- Hourly RSI14 plunged to 15.98, confirming panic-driven selling rather than an orderly pullback.
- A daily close below S1 support at $42.40 would confirm that sellers remain in full control.
Daily Chart: Advance Auto Parts Inc. Stock Breaks Below Every Major Average
The daily chart shows Advance Auto Parts Inc. stock has broken decisively below all three major moving averages in a single session. Price sits beneath its EMA20 at $55.19, EMA50 at $55.99, and EMA200 at $54.58. The gap below all three signals a shock event, not a gradual trend shift. All moving averages remain clustered in the mid-$50s, which suggests the stock had been consolidating before this breakdown.
Momentum confirms the damage. The daily RSI14 has dropped to 28.71, approaching oversold territory without reaching extreme exhaustion. Meanwhile, MACD is decisively negative. The line sits at -1.09, below the -0.31 signal, with a widening histogram of -0.78. That combination points to accelerating downside momentum rather than a fading move.
Volatility tells the same story. Price has pushed below the lower Bollinger Band at $49.54, a level rarely breached outside genuine volatility events. The ATR14 reading of 3.31 confirms daily ranges have expanded sharply. Notably, the system still tags the daily regime as neutral. However, this lag between raw price collapse and trend classification should be read with caution. The chart itself already looks bearish.
On the pivot framework, price trades between the daily pivot point at $44.81 and S1 support at $42.40. Resistance at R1 ($46.11) now looks distant after the gap down. A daily close below S1 would confirm sellers remain in control.
1H Timeframe Confirms the Bearish Break
The hourly chart removes any ambiguity left by the daily regime tag. Here the system explicitly reads bearish, and the indicators back that up emphatically. RSI14 on the 1H has fallen to 15.98. This deeply oversold reading reflects panic-driven selling rather than an orderly pullback.
MACD has widened further. The line reads -1.79 against a signal of -0.30, producing a histogram of -1.48. Price also trades below the hourly EMA20 at $54.67, EMA50 at $55.73, and EMA200 at $56.44. This reinforces the same structural break seen on the daily chart. The hourly lower Bollinger Band sits at $47.82, and price is trading below even that level. That confirms the volatility expansion extends beyond the daily candle alone.
Meanwhile, hourly pivots place price between the pivot point at $43.92 and S1 at $43.29. This tight range suggests the market is still searching for a short-term floor. Therefore, the daily and hourly timeframes are aligned rather than in conflict. Both show a stock in the grip of aggressive selling. Momentum indicators sit at or near extreme readings, with price trading outside its normal volatility envelope on both timeframes.
This alignment strengthens the bearish case in the near term. Still, extremely oversold RSI readings on the hourly chart can sometimes precede short, sharp relief bounces. Traders should remain alert to that possibility even as the dominant direction points lower.
15-Minute View: Execution Context Only
On the 15-minute chart, RSI14 has plunged to 9.16. This extreme reading typically reflects exhaustion-level selling pressure at the intraday level. MACD remains negative at -3.53 against a signal of -2.22. However, price at $43.70 is trading above the 15-minute lower Bollinger Band at $41.43. This is a short-term detail rather than a trend signal. It simply indicates that the sharpest part of the drop may be pausing within the immediate execution window.
Overall, the 15-minute pivot point sits at $43.77, with R1 at $43.85 and S1 at $43.62. This narrow band serves traders for timing entries rather than reading direction. The 15-minute view offers execution context without challenging the broader bearish structure established on higher timeframes.
Bullish Scenario: What Would Support a Recovery
A bullish case for Advance Auto Parts Inc. stock would require extreme oversold readings to trigger a genuine mean-reversion bounce. Price must first reclaim the daily pivot point at $44.81. A subsequent push toward R1 at $46.11 would offer an early sign that sellers are losing momentum.
Stabilization above the 15-minute EMA structure would add weight to the recovery argument. Meanwhile, narrowing MACD histograms on the hourly chart would further support the idea that the panic phase is fading. However, given how far price remains below the daily and hourly EMA200, any recovery would likely need time and confirmation. It could not be read as more than a short-covering bounce without sustained follow-through.
Bearish Scenario: What Would Invalidate the Bounce Case
The bearish scenario simply requires continuation of the current structure. A daily close below S1 support at $42.40 would confirm that sellers remain in full control. It would also signal that the earnings-driven gap has further to run.
In contrast, continued MACD widening on the daily chart would reinforce the trend. RSI staying compressed near current oversold levels without a bounce would show the downtrend is intact rather than exhausted. Should price fail to reclaim the daily pivot at $44.81 in the sessions ahead, the path of least resistance stays down. The lower Bollinger Band and ATR-driven volatility suggest further swings are likely before any base can form.
Closing Take
Overall, Advance Auto Parts Inc. stock is navigating a volatility shock triggered by a revenue miss and a soft FY26 outlook. These are layered on top of broader concerns about weakening DIY demand. The daily and hourly timeframes align in a bearish read. Price trades below every major moving average and outside its normal Bollinger range.
The 15-minute chart shows extreme short-term exhaustion, which leaves room for a technical bounce. However, that would need daily-level confirmation to matter. Elevated ATR readings and oversold momentum across timeframes point to continued uncertainty. Positioning should account for the possibility of sharp moves in either direction until the stock finds a stable footing.
FAQ
Why did Advance Auto Parts Inc. stock drop sharply?
Advance Auto Parts Inc. stock fell after the company reported earnings that missed revenue forecasts. The FY26 outlook also disappointed investors. Concerns about cash-strapped DIY customers pulling back on spending added to the selling pressure. Premarket trading saw shares tumble more than 15% before the open.
What are the key support levels for Advance Auto Parts Inc. stock?
The immediate support sits at the daily S1 pivot of $42.40. A daily close below this level would confirm continued bearish momentum. On the downside, price is currently searching for a short-term floor, with the hourly S1 pivot at $43.29 providing near-term reference.
Is Advance Auto Parts Inc. stock oversold?
Yes, across multiple timeframes. The daily RSI14 reads 28.71, approaching oversold territory. The hourly RSI14 has fallen to 15.98, and the 15-minute RSI14 has plunged to 9.16. These extreme readings reflect panic-driven selling but can sometimes precede short-term relief bounces.
Disclaimer: This article is for informational purposes only and does not constitute financial advice, an investment recommendation, or a solicitation to buy or sell any financial instrument or cryptocurrency. The analysis provided is not indicative of future results. Investing in crypto assets and financial markets carries a high risk of capital loss. Always do your own research (DYOR) and consult a qualified financial advisor before making any decision.
Article produced with the assistance of artificial intelligence and reviewed by the editorial team.






 English (US) ·