
 3 hours ago
10
3 hours ago
10

Singularity Future Technology Ltd stock fell from $4.60 to close at $3.48 on heavy volume of 305,879 shares. The daily chart confirms a downtrend, with price below all major moving averages and momentum firmly negative. The question now is whether SGLY stock stabilizes or extends lower.
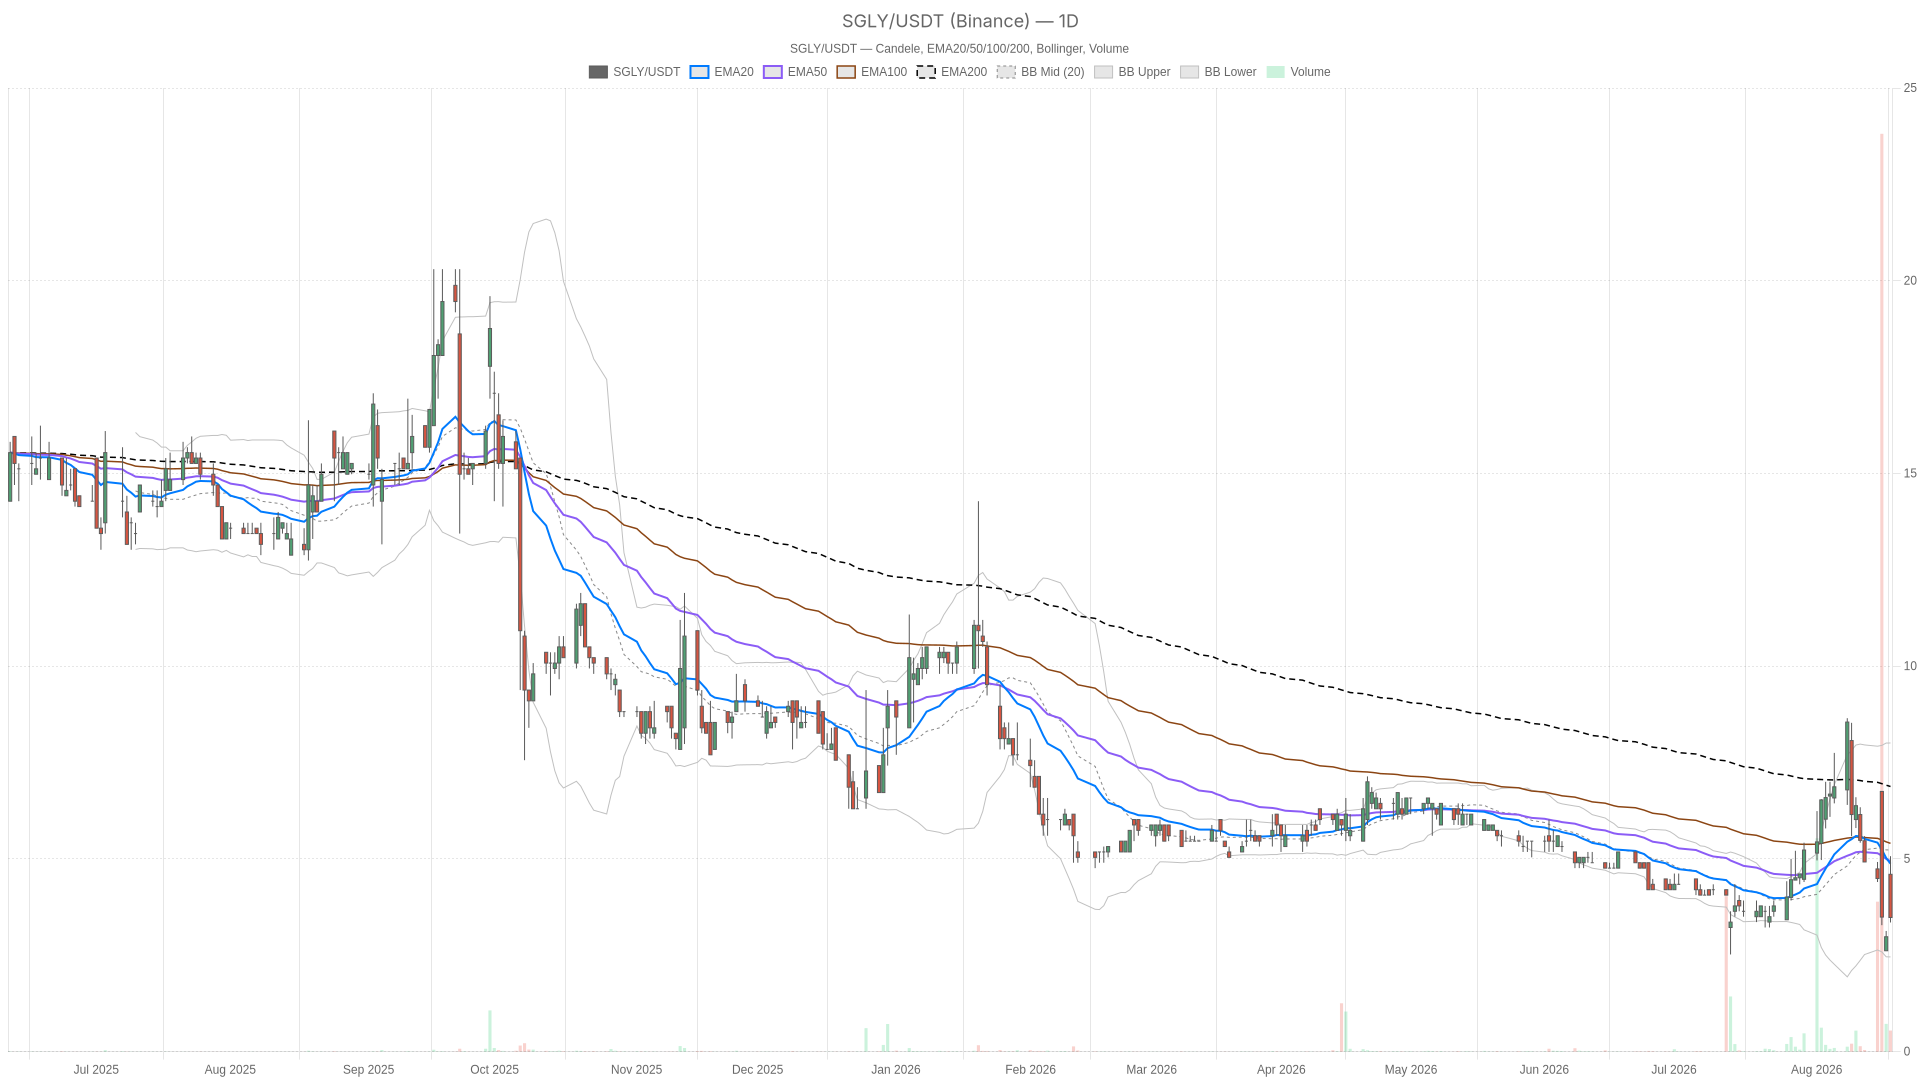 SGLY — daily chart with candlesticks, EMA20/EMA50 and volume.
Key takeaways
- SGLY stock dropped from an open of $4.60 to a close of $3.48 on volume of 305,879 shares.
- Daily RSI14 at 39.77 signals weak momentum without reaching oversold territory.
- MACD histogram at -0.38 on the daily chart reflects accelerating bearish momentum.
- Daily ATR14 at $1.49 represents extreme volatility relative to the $3.48 share price.
- Price closed below all three major EMAs — the EMA20 at $4.88, EMA50 at $4.94, and EMA200 at $6.88.
Daily Trend Sets a Bearish Tone for SGLY Stock
SGLY stock is in a textbook bearish alignment on the daily timeframe. Price closed at $3.48, well below the EMA20 at $4.88, the EMA50 at $4.94, and the EMA200 at $6.88. This configuration shows sellers are in control across short, medium, and long-term horizons alike.
RSI14 reads 39.77, comfortably under the neutral 50 line. However, it has not yet reached deeply oversold territory. That leaves room for further downside without triggering an immediate exhaustion signal. Meanwhile, MACD reinforces the same message: the line sits at -0.17 against a signal of 0.20, producing a histogram of -0.38. A negative and widening histogram typically reflects accelerating bearish momentum rather than a fading move.
The Bollinger Bands add useful context on volatility. With the mid-band at $5.23, the upper band at $8.01, and the lower band at $2.46, price closed much closer to the lower boundary than the middle. This is consistent with a stock under real selling stress. Notably, ATR14 stands at $1.49, an unusually wide reading relative to a $3.48 share price. In practical terms, this stock moves in a range representing a large percentage of its own value daily, raising the risk profile for anyone trading it.
Pivot levels frame the battlefield clearly. The daily pivot point sits at $3.97, with resistance at $4.58 (R1) and support at $2.86 (S1). Price closing below the pivot at $3.48 keeps the bias tilted toward the downside. The $2.86 level stands out as the next meaningful technical floor.
Hourly Chart Confirms Weakness but Shows Momentum Slowing
The hourly chart confirms the bearish structure but reveals early signs of momentum deceleration. The MACD histogram has narrowed to just -0.03, a meaningfully smaller negative reading than the -0.38 seen on the daily chart. This suggests downside momentum is losing some force at the hourly level, even if the broader trend has not reversed.
The EMA20 at $3.95, EMA50 at $4.84, and EMA200 at $5.01 all sit above the current $3.48 close, keeping the trend structure bearish. However, the hourly candle itself tells a more nuanced story. Opening at $3.38, ranging between $3.35 and $3.62, and closing at $3.48, the stock is holding steady rather than making fresh lows.
RSI14 on this timeframe reads 39.31, essentially mirroring the daily reading and confirming momentum remains weak. The hourly pivot point lands exactly at $3.48, matching the current close. Resistance sits at $3.62 and support at $3.35. Price pinned right on its own pivot signals indecision after the sharp daily drop. Meanwhile, the hourly Bollinger Bands still show price well below the mid-band at $4.13. With the upper band at $6.51 and lower at $1.76, the broader bearish tone remains intact.
15-Minute Chart Shows Short-Term Bounce Within a Downtrend
The 15-minute chart displays a short-term relief bounce, not a trend change. This timeframe carries a neutral regime tag, in contrast to the bearish labels on both the daily and hourly frames. RSI14 here reads 52.83, tilted slightly above the neutral midpoint, while the MACD histogram has flipped positive at 0.12.
Price action on this timeframe sits above the 15-minute EMA20 of $3.30. However, it remains below the EMA50 at $3.76 and far below the EMA200 at $5.06. The Bollinger Bands — mid at $3.12, upper at $3.74, lower at $2.51 — show price pushing toward the upper band. This is a classic short-term bounce signature. Therefore, the 15-minute structure should be read strictly as execution context. The tight 15-minute pivot range, with resistance at $3.55 and support at $3.44, underscores just how narrow this consolidation currently is.
Bullish Scenario: What Would Change the Picture for SGLY
For a genuine bullish case to build, SGLY stock would first need to reclaim the daily pivot at $3.97 and hold above it. A subsequent push through the daily EMA20 near $4.88 and toward the R1 resistance at $4.58 would provide the next meaningful confirmation. On the hourly chart, a sustained move back above the $3.62 resistance level would also be required. If paired with the MACD histogram shrinking toward positive territory, this would suggest the stabilization is becoming an actual reversal rather than just a pause.
Bearish Scenario: Downside Continuation Risk Remains Dominant
The bearish case remains the dominant one until proven otherwise. A daily close below the $2.86 support (S1) would open the door toward the lower Bollinger Band near $2.46. This would confirm the selloff has further to run. In contrast to a stabilization scenario, renewed weakness on the hourly chart — specifically a break below $3.35 — would invalidate any short-term bounce thesis. It would also reassert the bearish alignment across all three timeframes.
Positioning and Volatility Outlook for Singularity Future Technology Ltd Stock
Overall, the technical picture for Singularity Future Technology Ltd stock remains bearish on the primary daily timeframe. The hourly chart confirms that structure while showing early signs of momentum deceleration. Meanwhile, the 15-minute chart reflects a short-term bounce that should not be mistaken for a trend change. Given an ATR14 of $1.49 against a $3.48 close, volatility is elevated. Price swings are likely to remain large in both directions. Uncertainty is high. The conflicting signals across timeframes call for caution rather than conviction in either direction. Ultimately, the daily pivot and support levels will resolve the current indecision.
FAQ
What is the current trend for SGLY stock?
The daily trend for SGLY stock is bearish. Price closed at $3.48, below the EMA20 ($4.88), EMA50 ($4.94), and EMA200 ($6.88). RSI14 at 39.77 and a widening MACD histogram at -0.38 confirm negative momentum across the primary timeframe.
What are the key support levels for Singularity Future Technology Ltd stock?
The immediate support sits at the daily S1 pivot of $2.86. Below that, the lower Bollinger Band at $2.46 represents the next technical floor. On the hourly chart, the $3.35 level serves as near-term support, with a break below it signaling renewed selling pressure.
Is there any sign of a reversal for SGLY stock?
The 15-minute chart shows a short-term bounce, with RSI14 at 52.83 and a positive MACD histogram of 0.12. However, this is a relief move within a larger downtrend, not a confirmed reversal. A bullish reversal would require reclaiming the daily pivot at $3.97 and pushing above the EMA20 near $4.88.
Disclaimer: This article is for informational purposes only and does not constitute financial advice, an investment recommendation, or a solicitation to buy or sell any financial instrument or cryptocurrency. The analysis provided is not indicative of future results. Investing in crypto assets and financial markets carries a high risk of capital loss. Always do your own research (DYOR) and consult a qualified financial advisor before making any decision.
Article produced with the assistance of artificial intelligence and reviewed by the editorial team.






 English (US) ·