
 2 hours ago
17
2 hours ago
17

Alibaba Group Holding Limited stock closed at $128.90 on August 19, just above its daily pivot of $128.65. The technical picture looked constructive heading into earnings. Then a 75% drop in net income reset the narrative overnight.
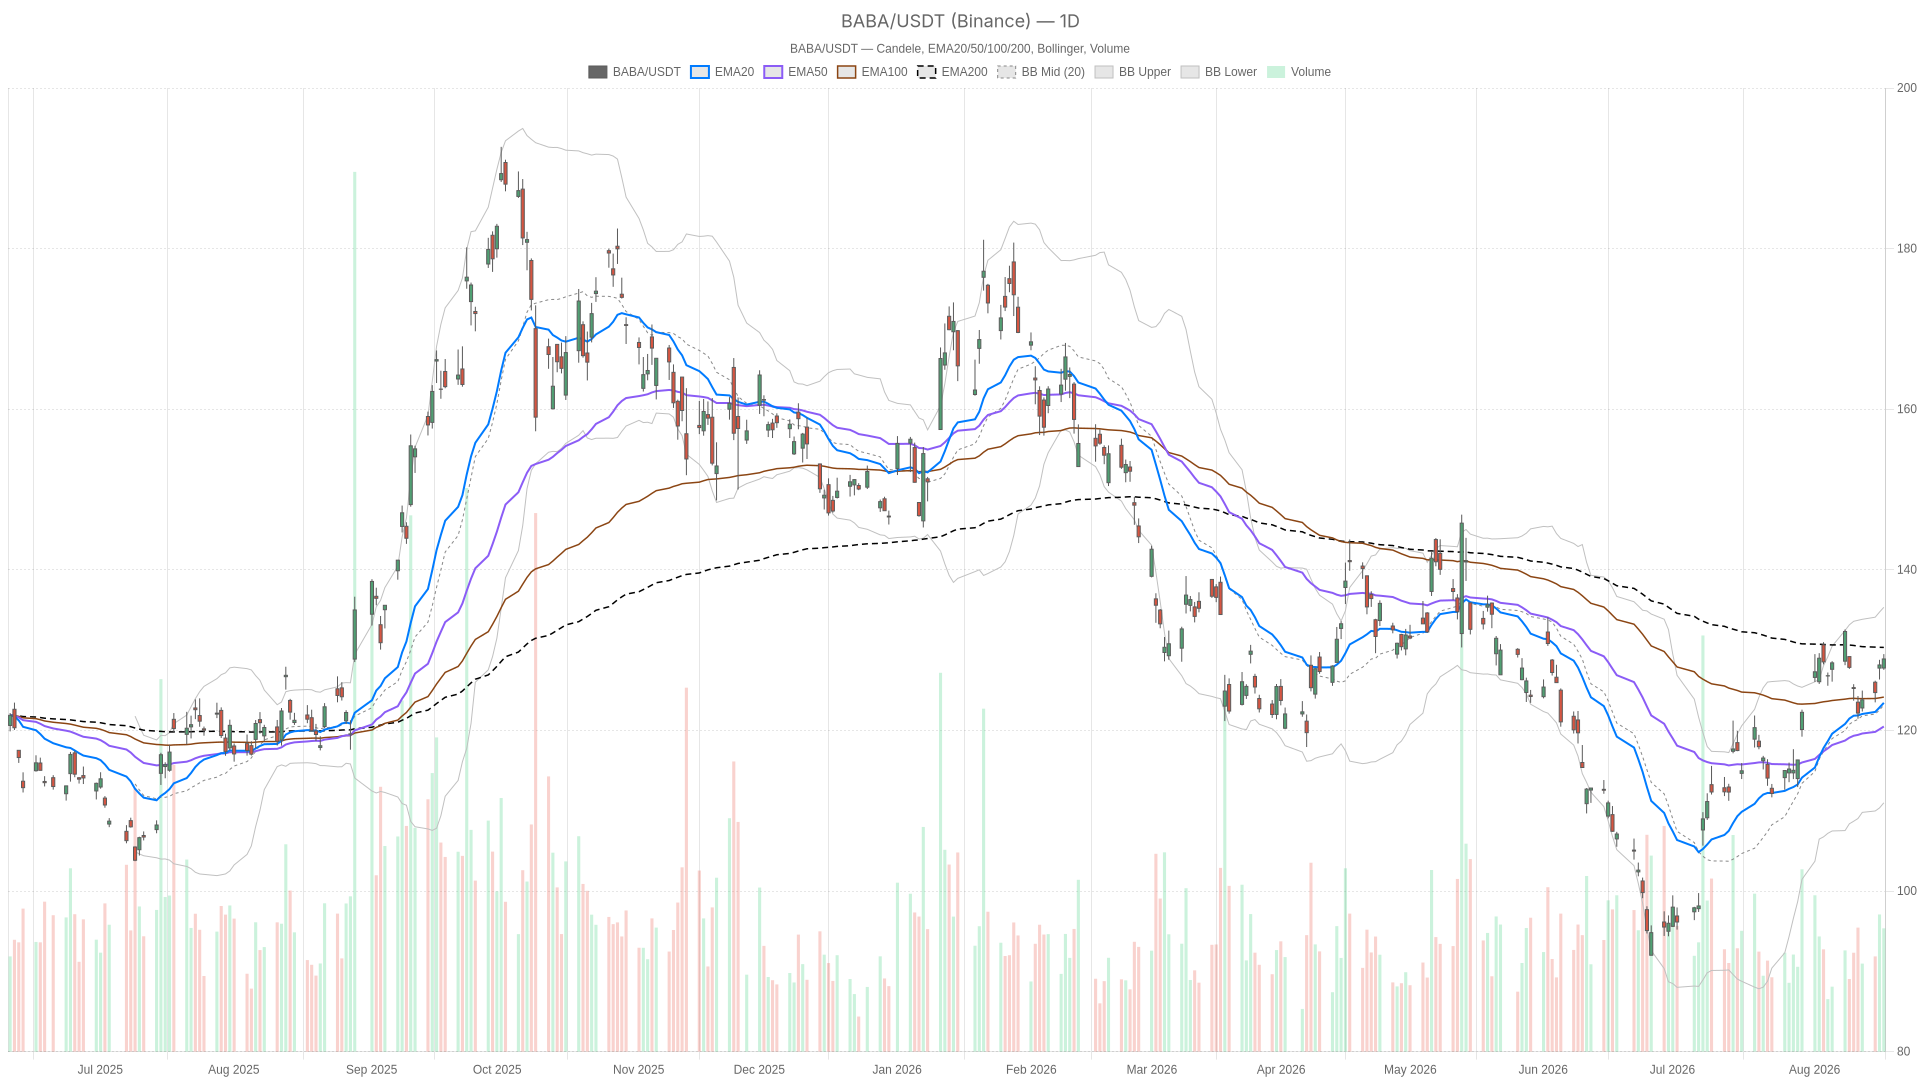 BABA — daily chart with candlesticks, EMA20/EMA50 and volume.
Key takeaways
- BABA closed at $128.90 on August 19, holding above the 20-EMA ($123.43) and 50-EMA ($120.48).
- The daily 200-EMA at $130.33 remains the key resistance capping any broader trend shift.
- Alibaba reported a roughly 75% drop in net income for the June quarter, driven by heavy AI infrastructure spending.
- U.S.-listed shares fell as much as 4% in early trading, overshadowing 9% revenue growth.
- The 1-hour chart remains bullish with a clean EMA stack, but RSI14 at 68.08 signals stretched conditions.
Daily Chart: Constructive Structure Still Capped by the 200-EMA
BABA holds a constructive but neutral daily structure. Short-term moving averages provide support, yet the 200-EMA at $130.33 keeps the broader trend in check.
EMA Alignment Capped by the 200-EMA
On the daily timeframe, price is holding above both the 20-EMA ($123.43) and the 50-EMA ($120.48). That alignment usually favors buyers in the short and medium term. At the same time, BABA remains below its 200-EMA at $130.33. This level keeps capping the broader trend. The gap between near-term strength and long-term resistance is why the daily regime reads as neutral rather than outright bullish.
Momentum and Volatility: Mixed Signals Near Resistance
The daily RSI14 stands at 61.58. That is comfortably above the midline but not yet in overbought territory. It supports the idea of underlying demand without signaling exhaustion. MACD, however, tells a more cautious story. The line sits at 3.42 against a signal of 3.53, producing a slightly negative histogram of -0.11. In practical terms, daily momentum is losing thrust even as price holds up. That is a subtle warning near resistance.
Bollinger Bands add useful context. The mid-band at 123.16 has effectively flipped into support. The upper band near 135.33 leaves plenty of room above current price. Meanwhile, the lower band at 110.99 sits far below spot. Volatility compression is clearly not the daily issue here. ATR14 of 3.87 points to normal, healthy swings for a stock of Alibaba’s size rather than panic-driven moves. Notably, the daily pivot at 128.65 sits almost exactly at spot. Resistance rests at 129.75 (R1) and support at 127.79 (S1). Price is essentially straddling that pivot, which usually signals daily-level indecision.
1H Momentum Confirms Short-Term Bullish Tilt
The 1-hour chart paints a more decisively bullish picture. Price at 128.97 sits above the 20-EMA (127.36), the 50-EMA (126.32) and the 200-EMA (120.77). This is a clean bullish stack. The 1H regime is explicitly labeled bullish. That alignment confirms short-term buyers stayed in control into the latest session.
RSI14 at 68.08 on the hourly chart reads closer to overbought than the daily figure. The recent push higher has been fairly aggressive. Stretched readings like this often precede a pause, or at least a shallow pullback, even inside an active uptrend. The 1H MACD line at 1.07 sits above its signal at 0.89, with a positive histogram of 0.18. Momentum is still expanding on this timeframe. Therefore, the 1-hour chart confirms the bullish push more clearly than the daily chart. The two frames, however, disagree on how much fuel is actually left in the tank.
Bollinger Bands on the hourly chart show price pressing close to the upper band at 130.66. The mid-band at 127 acts as the nearest pullback pivot. ATR14 here is 1.06, modest in absolute terms but meaningful for intraday positioning. Hourly pivot levels frame a tight battleground just above current price, with support at 128.20 (S1) and resistance at 129.42 (R1).
15-Minute Execution: Tight Consolidation Near Resistance
On the 15-minute chart, price has settled at 128.97. It sits wedged between the pivot at 128.66 and R1 at 129.37. The EMA structure here is also bullish. The 20-EMA (128.55) holds above both the 50-EMA (127.83) and the 200-EMA (126.61). RSI14 at 57.27 is more neutral than the hourly reading. This suggests the very short-term move has cooled relative to the broader 1-hour push.
MACD on this timeframe has turned slightly negative. The line at 0.17 sits below the signal at 0.26, with a histogram of -0.08. That looks like a short-term momentum stall rather than an outright reversal. It is consistent with a market pausing to digest recent gains. Bollinger Bands are notably tight here. The upper band rests at 129.34, the lower band at 128.05. Meanwhile, ATR14 has compressed to just 0.48. Volatility this tight on the smallest timeframe often signals the market is coiling ahead of a bigger directional move.
Alibaba Group Holding Limited Stock Faces a Post-Earnings Reset
Just as the technical setup was building a case for continuation, fresh headlines changed the calculus. Alibaba Group Holding Limited stock is now absorbing a profit shock. The company reported a roughly 75% drop in net income for the June quarter. Heavy capital expenditure on AI infrastructure drove the decline. At the same time, revenue rose 9% and the AI-driven cloud business kept accelerating.
U.S.-listed shares fell as much as 4% in early trading, while other reports cited a 3% decline. The profit miss overshadowed otherwise strong cloud growth. It is a textbook case of the market punishing near-term earnings optics over long-term strategic investment, at least in the initial reaction.
Notably, the technical readings above are drawn from the last completed daily candle on August 19, before this news broke. That timing gap matters. The daily and hourly charts describe a market that looked constructive heading into the print. The news flow describes a market reacting negatively to what it found inside that print. Until fresh price action absorbs the earnings reaction, the technical structure and the fundamental catalyst are effectively out of sync.
Bullish Scenario
For bulls, the case rests on treating heavy AI spending as a growth investment rather than a red flag. Alibaba’s cloud business keeps benefiting from AI demand. Meanwhile, 9% revenue growth confirms that top-line momentum remains intact. If BABA can hold above the daily pivot at 128.65 and defend support near 127.79 (S1), the bullish setup could reassert itself. This alignment is already visible on the 1-hour and 15-minute charts. A reclaim of the daily 200-EMA at 130.33 would be an important signal. It would suggest buyers are willing to look past the profit miss and focus on the AI-driven revenue story instead.
Bearish Scenario
On the other hand, the bear case leans on just how sharply net income fell. A 75% drop in profit is not a minor miss. Markets tend to punish gaps between revenue growth and bottom-line delivery. If post-earnings selling pushes price back below daily support at 127.79, the constructive setup would erode. A move toward the daily 50-EMA at 120.48 would invalidate the bullish shorter-timeframe picture entirely. A break below the hourly 200-EMA at 120.77 would confirm the bullish stack has failed. Sellers would then have taken control across timeframes.
Closing Take
Overall, Alibaba Group Holding Limited stock is caught between a technically constructive setup and a fresh fundamental shock. The daily chart remains neutral, capped by the 200-EMA. The hourly chart, meanwhile, shows genuine bullish momentum with RSI approaching stretched levels. The 15-minute chart’s volatility compression suggests the market was already bracing for a bigger move. This was visible before the earnings reaction hit the tape.
Given the profit miss and resulting share price pressure, volatility is likely to stay elevated in the sessions ahead. Positioning around the pivot, support and resistance levels will matter more than usual. The current technical picture should be treated as provisional until price fully reflects the post-earnings adjustment.
FAQ
What caused Alibaba stock to drop after earnings?
Alibaba reported a roughly 75% drop in net income for the June quarter. The decline was driven by heavy capital expenditure on AI infrastructure. Although revenue rose 9% and the cloud business accelerated, the profit miss overshadowed the top-line strength. U.S.-listed shares fell as much as 4% in early trading.
Is Alibaba Group Holding Limited stock still technically bullish?
The picture is mixed. The daily chart remains neutral, capped by the 200-EMA at $130.33. The 1-hour chart, however, shows a clean bullish EMA stack with price above all three key moving averages. RSI14 on the hourly chart reads 68.08, which is stretched but not yet reversing. Until post-earnings price action settles, the technical structure should be treated as provisional.
What are the key levels to watch for Alibaba stock?
Key support sits at the daily pivot of 128.65 and S1 at 127.79. Below that, the daily 50-EMA at 120.48 and the hourly 200-EMA at 120.77 are critical. On the upside, the 200-EMA at 130.33 is the main resistance. A reclaim of that level would signal buyers are looking past the profit miss.
How significant is the 200-EMA for Alibaba’s outlook?
The 200-EMA at 130.33 is the primary ceiling on the daily chart. BABA has been holding below it despite constructive shorter-term EMA alignment. A break above would mark a meaningful shift in the broader trend. Until then, the daily regime remains neutral regardless of hourly bullish signals.
Disclaimer: This article is for informational purposes only and does not constitute financial advice, an investment recommendation, or a solicitation to buy or sell any financial instrument or cryptocurrency. The analysis provided is not indicative of future results. Investing in crypto assets and financial markets carries a high risk of capital loss. Always do your own research (DYOR) and consult a qualified financial advisor before making any decision.
Article produced with the assistance of artificial intelligence and reviewed by the editorial team.






 English (US) ·