
 2 hours ago
10
2 hours ago
10

Strategy Inc stock closed at $104.25, rebounding sharply from a $94.30 low as Bitcoin surged past $69,000. The correlation is clear—MSTR’s Bitcoin-heavy balance sheet drives the price action. Yet a bounce is not a reversal, and the daily chart still bears scars from a much deeper decline.
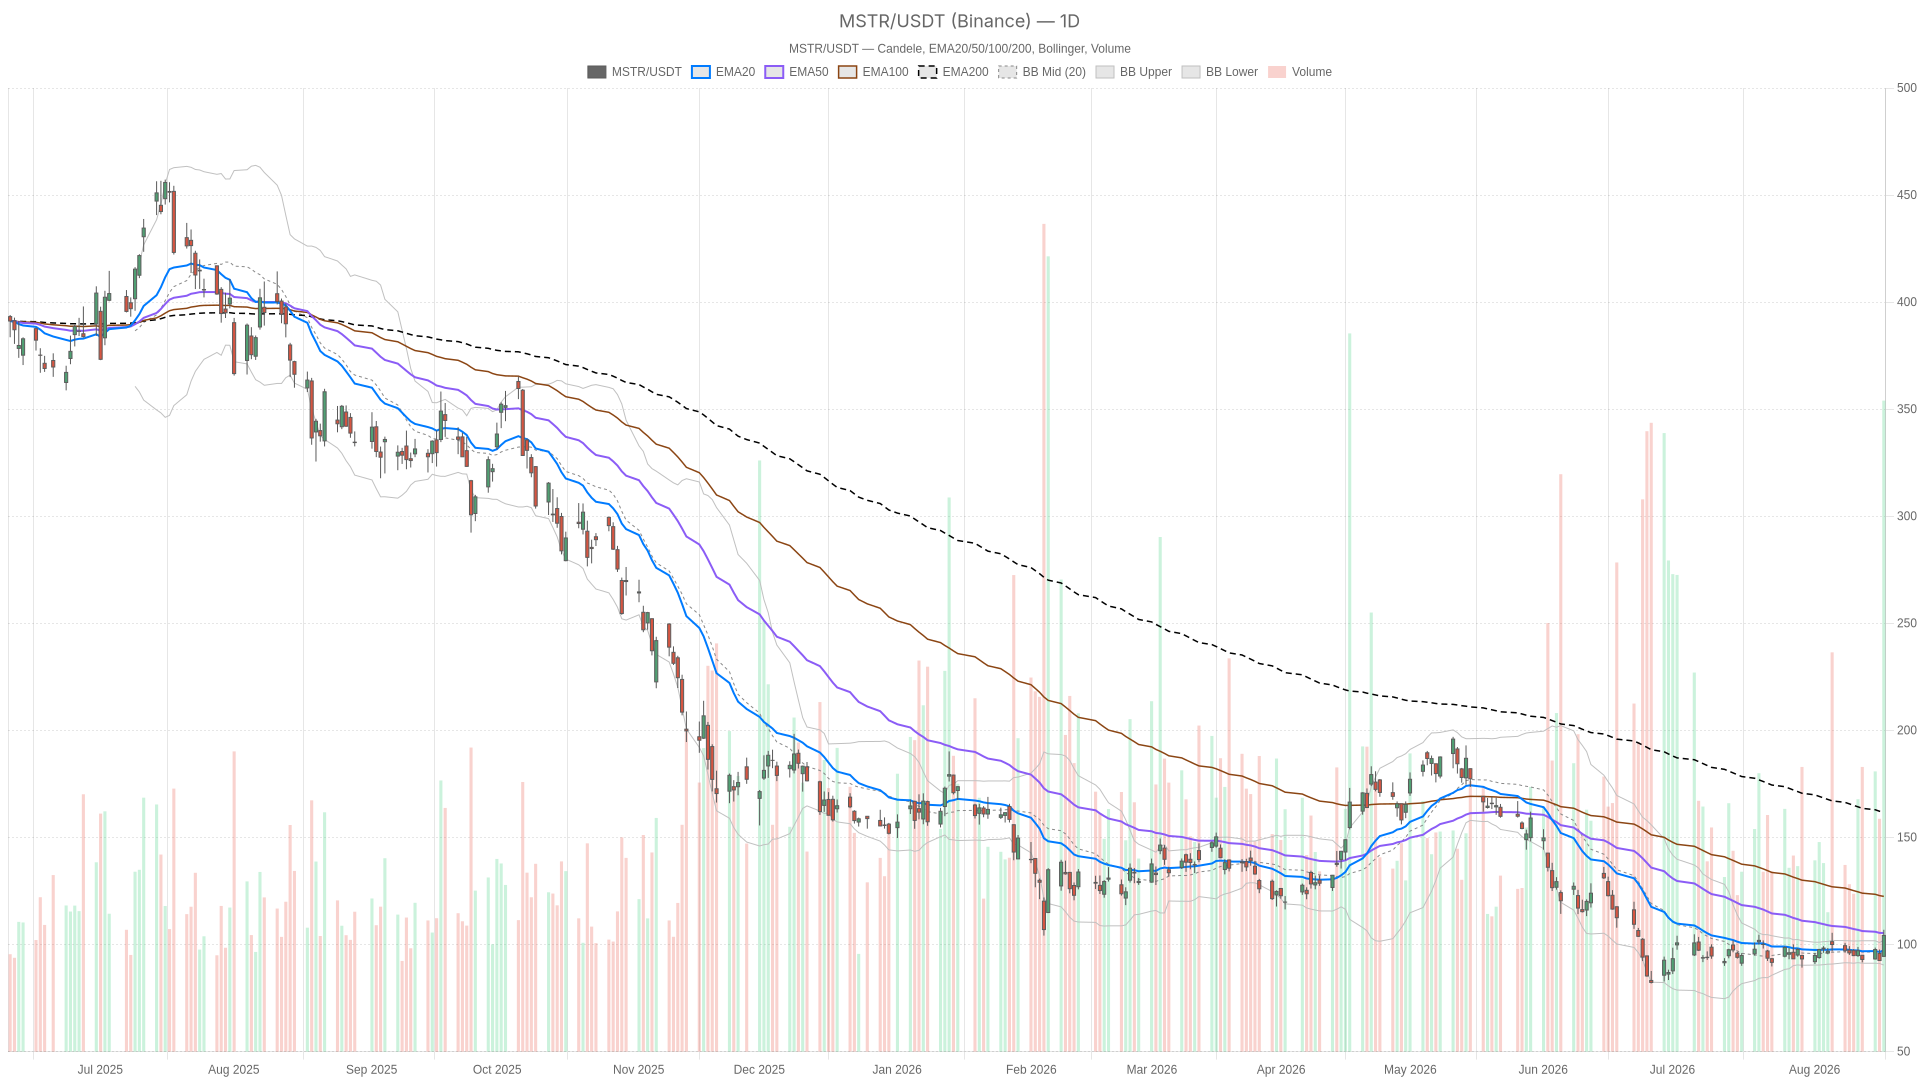 MSTR — daily chart with candlesticks, EMA20/EMA50 and volume.
Key takeaways
- MSTR closed at $104.25, up from a session low of $94.30, powered by Bitcoin’s push above $69,000.
- Price sits above the 20-EMA ($97.26) but remains below the 50-EMA ($105.39) and far below the 200-EMA at $161.67.
- Daily RSI at 55.74 reflects neutral momentum, while the MACD histogram has turned positive at 0.99.
- Michael Saylor floated a potential share buyback, with the firm holding a $4.8 billion cash reserve.
- Volatility remains elevated, with daily ATR above 5.7 points, keeping swing risks high in both directions.
Daily Chart: A Bounce Inside a Still-Damaged Trend
Strategy Inc stock is attempting a recovery inside a long-term downtrend, trading above its 20-EMA but still far below both the 50-EMA and the 200-EMA.
EMA Structure Exposes the Long-Term Damage
Price trades above the 20-period EMA at $97.26—a short-term positive. However, it remains below the 50-EMA at $105.39. More importantly, it sits nowhere close to the 200-EMA at $161.67. That gap is enormous. It reflects the roughly 73% year-over-year decline that Michael Saylor himself referenced when discussing a possible buyback. This is a recovery attempt inside a long-term downtrend, not evidence that the downtrend has ended.
Momentum Indicators Flash Mixed Signals
The daily RSI at 55.74 sits in neutral territory—leaning mildly constructive but far from overbought. MACD tells a more nuanced story. The line at -1.12 remains below the signal at -2.11, keeping the broader momentum reading negative. Yet the histogram has turned positive at 0.99. This means bearish momentum is losing steam even if it hasn’t flipped outright bullish. That distinction matters for anyone tracking Strategy Inc stock right now.
Bollinger Bands Warn of Overextension
Price closed at $104.25, above the upper band at $102.09. The mid-band sits at $96.25 and the lower band at $90.42. A close outside the upper band signals strong short-term momentum. But it also raises the odds of a near-term pullback or consolidation before the next leg. Daily ATR of 5.72 confirms high volatility. Meanwhile, the pivot structure—with pivot point at $101.82, resistance at $109.33, and support at $96.73—frames the next battle zone. The system’s regime tag reads neutral, which fits: a strong upside thrust, but not yet a confirmed trend change.
1H Timeframe: Confirmation, With a Catch
On the one-hour chart, Strategy Inc stock is unambiguously bullish, with price above all three EMAs and momentum indicators supporting the move.
The one-hour chart shows price at $104.22 trading above all three EMAs—$99.52, $97.71, and $97.49—a clean bullish stack. RSI at 63.94 supports the move without flashing overbought warnings. MACD is comfortably positive, with the line at 2.17 above the signal at 1.30 and a histogram of 0.87. Hourly pivot resistance sits at $104.83, just above the current close. Buyers are pressing directly into the next decision point.
Therefore, the 1H timeframe confirms the daily bounce rather than contradicting it. The catch is that this confirmation occurs on a much shorter horizon than the damage visible on the daily 200-EMA. Short-term momentum is real, but it runs against a backdrop where the 200-EMA is still roughly 55% above current price. That is the core tension in this setup.
15-Minute Execution Context
On the 15-minute chart, Strategy Inc stock is consolidating just above its pivot point, with early signs of short-term momentum cooling.
Price consolidates just above the pivot point of $104.13, between support at $103.76 and resistance at $104.59. The EMA stack—$103.04, $100.53, and $97.53—remains bullish. RSI at 61.34 is still constructive. Notably, however, the MACD histogram has slipped negative at -0.36, even as the MACD line stays above the signal. This is an early sign of short-term momentum cooling. The rally may need to digest recent gains before attempting the next push toward daily resistance near $109.33.
News Flow: Bitcoin Correlation and Corporate Signals
Strategy Inc stock’s fundamental backdrop reinforces the technical picture, with Bitcoin’s rally and mixed corporate signals both shaping the current setup.
Bitcoin’s Macro Tailwind
Bitcoin’s surge past $69,000 followed a White House meeting between President Trump and crypto executives. Trump also urged Congress to pass the CLARITY Act. For a company whose stock trades largely on its Bitcoin exposure, that macro tailwind matters directly.
Mixed Corporate Narrative
The corporate picture is more nuanced. Q2 13F filings showed 12 of Strategy’s 15 largest institutional holders added shares despite the firm’s Bitcoin sales. This signals that long-term conviction hasn’t disappeared. On the other hand, CEO Phong Le confirmed Bitcoin accumulation will resume later this year. That implicitly acknowledges the company isn’t buying right now, which some observers see as a concern. Meanwhile, Michael Saylor floated the idea of a share buyback, though only if MSTR trades at a deep enough discount to net asset value. The firm sits on a $4.8 billion cash reserve. Saylor also reiterated his long-term, four-year-plus framing for Bitcoin exposure—a reminder that near-term price action is only part of the story.
Bullish Scenario
For the bullish case to gain traction, Strategy Inc stock must reclaim the daily 50-EMA at $105.39 and push through pivot resistance at $109.33.
A sustained move above the 50-EMA would confirm renewed momentum. Ideally, the daily MACD histogram would keep expanding rather than fading. Continued strength in Bitcoin above $69,000 would help. So would the hourly RSI staying above 60 without stalling. If institutional accumulation continues into the next filing cycle, that would add fundamental support to the technical setup.
Bearish Scenario
The bearish risk for Strategy Inc stock centers on rejection at current levels, with a break below the 20-EMA at $97.26 signaling the bounce was short-lived.
In this scenario, a failure to hold above the daily upper Bollinger Band would suggest the rally was largely momentum-driven. A slide below daily support at $96.73 would be a clear invalidation signal. This becomes more damaging if the 1H EMA stack rolls over simultaneously. Given the daily MACD line remains below its signal line, a renewed widening of that gap would confirm bearish control resuming. Focus would shift back toward the 200-EMA at $161.67 as a stark reminder of the distance required to repair the long-term chart.
Closing Take
Strategy Inc stock is caught between two timeframes telling opposing stories—a damaged daily structure and genuine short-term bullish momentum.
The daily chart shows a neutral, still-recovering structure inside a severe long-term downtrend. Meanwhile, the hourly and 15-minute charts confirm real short-term bullish momentum, tied closely to Bitcoin’s rally and supportive institutional flows. Volatility remains elevated, with daily ATR above 5.7 points, meaning swings in either direction should be expected. Given the mixed signals between the long-term trend and the short-term thrust—and with corporate commentary from Saylor and Le adding further uncertainty—position sizing and patience matter more than conviction in either direction right now.
FAQ
Why is Strategy Inc stock rebounding right now?
The primary catalyst is Bitcoin’s surge past $69,000 following a White House meeting between President Trump and crypto executives. Given MSTR’s heavy Bitcoin balance sheet exposure, the correlation is doing most of the heavy lifting for the stock’s rebound.
Is the rebound in Strategy Inc stock sustainable?
The daily chart shows mixed signals. Price is above the 20-EMA at $97.26 and the MACD histogram has turned positive at 0.99. However, price remains below the 50-EMA at $105.39 and far below the 200-EMA at $161.67. The bounce has momentum but hasn’t confirmed a long-term trend reversal.
What are the key levels to watch for Strategy Inc stock?
On the upside, the 50-EMA at $105.39 and pivot resistance at $109.33 are critical hurdles. On the downside, support sits at the 20-EMA ($97.26) and daily pivot support at $96.73. A break below $96.73 would invalidate the current bounce.
What is Michael Saylor’s current stance on Strategy Inc stock?
Michael Saylor has floated the idea of a share buyback if MSTR trades at a deep enough discount to net asset value, with the firm holding a $4.8 billion cash reserve. He also reiterated his long-term, four-year-plus framing for Bitcoin exposure, signaling patience over short-term price action.
Disclaimer: This article is for informational purposes only and does not constitute financial advice, an investment recommendation, or a solicitation to buy or sell any financial instrument or cryptocurrency. The analysis provided is not indicative of future results. Investing in crypto assets and financial markets carries a high risk of capital loss. Always do your own research (DYOR) and consult a qualified financial advisor before making any decision.
Article produced with the assistance of artificial intelligence and reviewed by the editorial team.






 English (US) ·