
 1 hour ago
14
1 hour ago
14

AMD stock suffered a sharp daily setback, closing at 466.42 after sellers pushed price decisively below both the 20-day and 50-day EMAs. However, the 200-day EMA at 362.07 remains far beneath current levels. The gap between short-term weakness and long-term structure makes this setup worth dissecting.
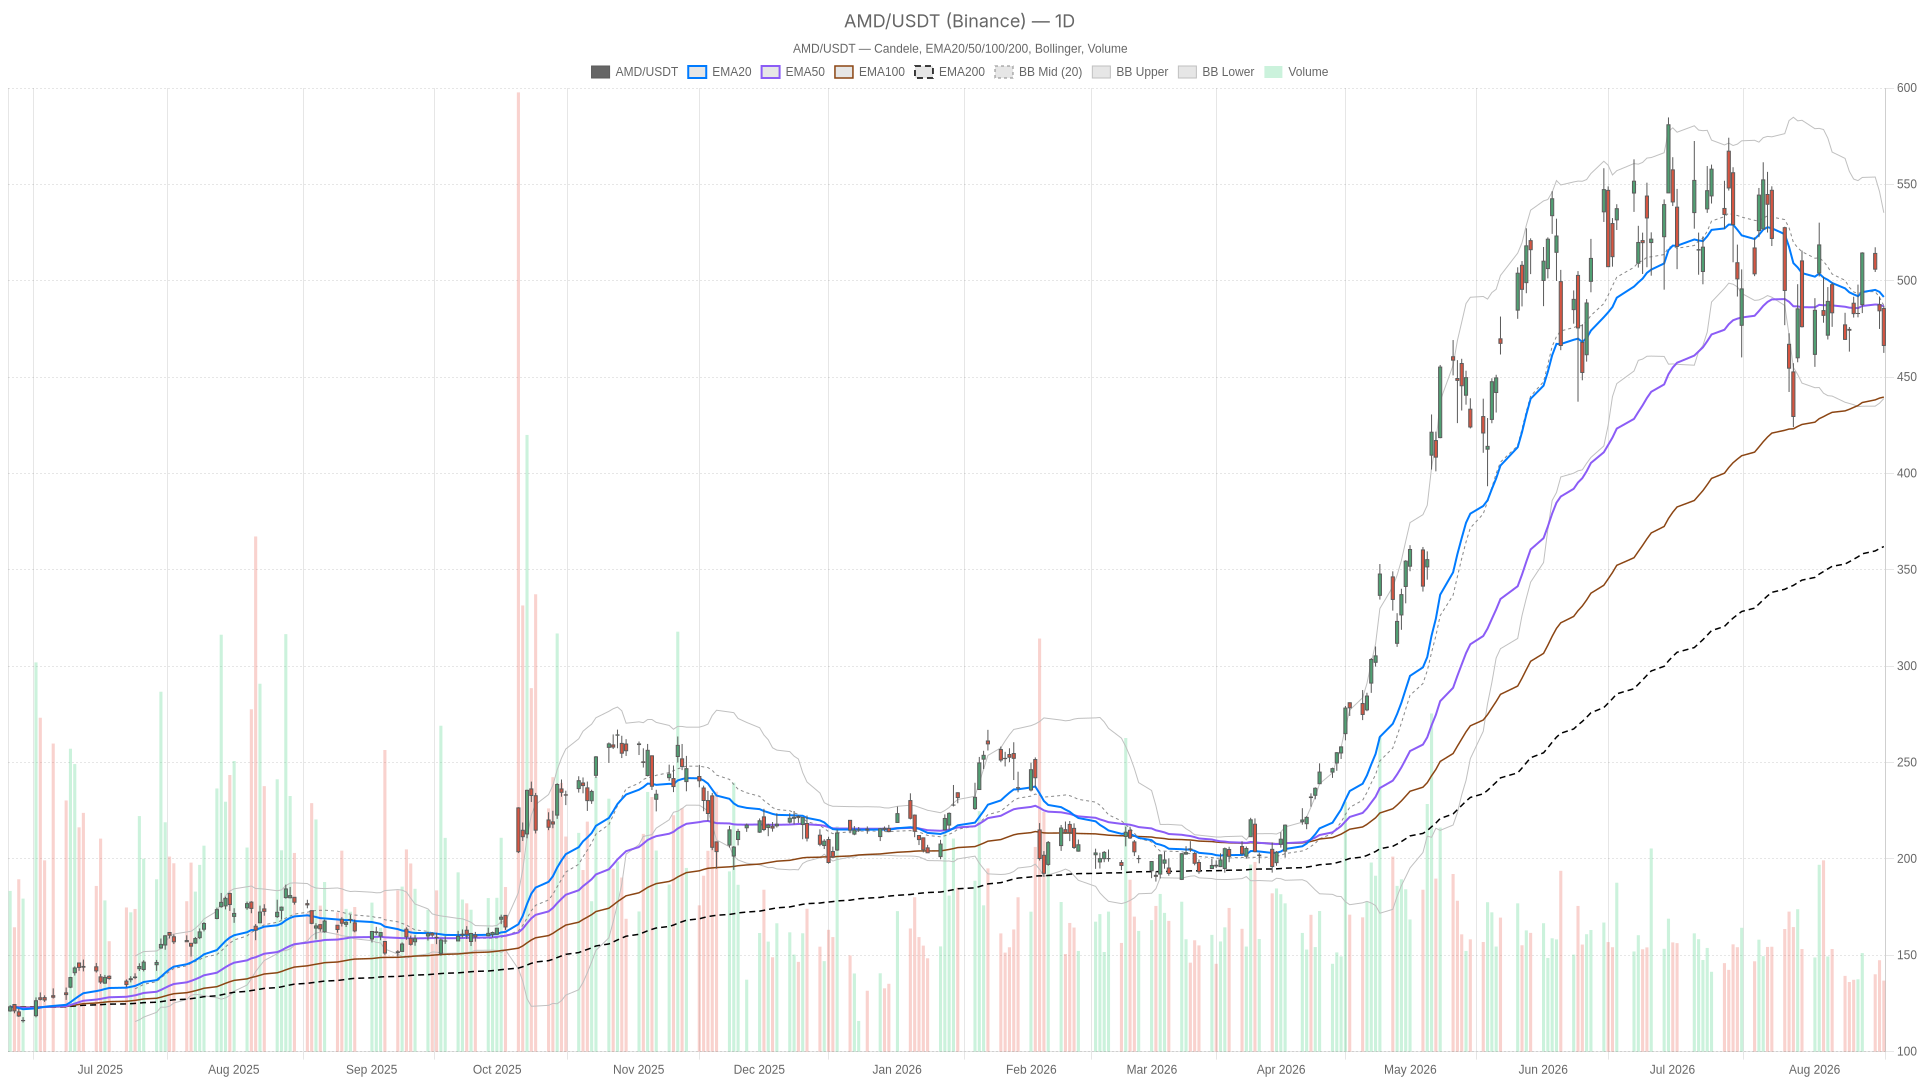 AMD — daily chart with candlesticks, EMA20/EMA50 and volume.
Key takeaways
- AMD closed at 466.42 after a sharp sell-off, dropping below both the 20-day EMA (491.56) and 50-day EMA (486.70).
- The daily RSI14 sits at 44.16, signaling neutral momentum tilted toward the weaker side.
- The 200-day EMA at 362.07 remains intact, preserving the broader long-term uptrend structure.
- Hourly charts show full bearish alignment, with price below the 20-hour, 50-hour, and 200-hour EMAs.
- Daily support rests at 456.98; a break below that level would signal a deeper pullback.
AMD Stock Price Action: Daily Structure Turns Neutral After Sharp Pullback
AMD stock’s daily structure has shifted to neutral following the sharp pullback. Price closed below both short-term EMAs while the 200-day trend remains intact. RSI14 sits at 44.16, comfortably out of oversold territory but tilted toward softer momentum. MACD readings tell a similar story: the MACD line at -6.34 remains below its signal at -6.52. However, the histogram has ticked up to 0.18. This suggests the bearish momentum that drove the drop may be losing force, though the broader signal has not flipped yet.
Bollinger Bands and Pivot Levels Define Boundaries
Meanwhile, Bollinger Bands add another layer. Price at 466.42 sits below the mid-band of 487.06. It drifts toward the lower band at 438.87, while the upper band sits far above at 535.26. This is not an oversold extreme, but it confirms price has moved meaningfully off its recent equilibrium. An ATR14 reading of 26.62 reinforces the message: volatility has expanded, and single-session swings are now large by AMD’s own recent standards.
Pivot levels, in turn, reinforce the near-term battle. The daily pivot point stands at 471.99, with resistance at 481.43 and support at 456.98. Price closing at 466.42 places it below the pivot, inside the lower half of that range. In practice, sellers still control the immediate structure. Still, the longer-term uptrend implied by the 200-day EMA has not been broken.
Hourly Momentum Confirms Near-Term Weakness in AMD Stock
Near-term weakness in AMD stock is confirmed by the hourly chart: a full bearish EMA alignment leaves no ambiguity about short-term direction. The 1-hour timeframe carries an explicitly bearish regime, with every moving average confirming the bias. Price at 466.38 sits below the 20-hour EMA at 479.06, the 50-hour EMA at 485.44, and the 200-hour EMA at 498.39. That full stack alignment below all three averages is a textbook bearish structure.
At the same time, RSI14 on the hourly chart has slipped to 33.08, edging close to oversold without confirming exhaustion. The MACD line at -8.03 sits well below its signal at -5.84, and the histogram has widened to -2.18. Unlike the daily chart, there is no sign of momentum stabilizing here. This actively deteriorating short-term picture weakens any argument for an immediate bounce.
Similarly, the hourly Bollinger setup shows price between the mid-band of 484.36 and the lower band of 449.10. This is consistent with a market still searching for a floor. ATR14 reads 7.6, confirming elevated intraday volatility without signaling panic. Pivot data is notably tight: the pivot sits at 466.85, resistance at 467.85, and support at 465.38. Price closing at 466.38 hovers right at the pivot, signaling indecision even as the broader hourly trend stays bearish.
Execution Context: 15-Minute Chart Shows Consolidation Near Pivot
The 15-minute chart shows AMD stock consolidating near the pivot rather than extending its sell-off. Compressed volatility hints at a pause before the next directional move. The regime is also labeled bearish, but internal readings suggest a pause rather than fresh selling pressure. Price at 466.38 sits just under the 20-period EMA of 467.81. It also rests further below the 50-period EMA at 474.73 and the 200-period EMA at 487.33. RSI14 reads 39.71, consistent with broader softness but not extreme.
Notably, the MACD histogram on this timeframe has turned positive at 0.74. Still, the MACD line at -2.28 remains below its signal at -3.03. This mirrors the daily chart pattern: bearish momentum with early signs of deceleration. Bollinger Bands here are unusually tight, with the mid-band at 466.68, upper at 468.42, and lower at 464.93. ATR14 has compressed to just 2.02, confirming short-term volatility has calmed considerably.
Pivot levels mirror the hourly picture almost exactly. The pivot point stands at 466.66, with resistance at 467.47 and support at 465.57. Price sitting on that pivot suggests the market is pausing to digest the prior session’s decline before committing to a clear next move.
Bullish Scenario for AMD Stock
AMD stock’s bullish case hinges on the intact long-term uptrend, with the 200-day EMA far below current price providing a structural floor that this pullback has not breached. The 200-day EMA remains positioned at 362.07, keeping the primary uptrend technically intact. A recovery above the daily pivot at 471.99, followed by a reclaim of 481.43 resistance, would begin repairing the short-term picture. If the daily MACD histogram keeps building on its 0.18 reading and turns more convincingly positive, that would add technical weight to a bounce thesis.
The news backdrop offers some support. Coverage from The Motley Fool notes that fair value estimates for AMD stock continue to rise. Separate analysis frames the company as a potential multibagger over a five-year horizon, tied to its AI chip growth story. That longer-term narrative does not resolve the immediate technical weakness. However, it provides a fundamental floor that bulls can reference during pullbacks like this one.
Bearish Scenario and Invalidation Levels
The bearish case for AMD stock is built on consistent near-term technical weakness across hourly and 15-minute timeframes. Key support at 456.98 marks the line that must hold to avoid a deeper sell-off. The hourly chart’s full EMA stack, with price below the 20, 50, and 200-hour averages, stands as a clear warning. If price fails to hold the hourly pivot near 466.85 and breaks below daily support at 456.98, the pullback could extend further. Elevated ATR readings across both daily and hourly charts reinforce this risk.
On the fundamental side, news flow adds caution as well. One report flagged that AMD is forecasting soft demand from gaming and PC markets, a note tied to a session where the stock fell 3.71%. This points to real near-term demand friction in parts of AMD’s business. Separately, Cathie Wood’s ARK sold AMD stock while adding to Rocket Lab. Some traders may read that rotation as reduced institutional enthusiasm. However, it may reflect portfolio-specific decisions rather than a broad AMD stock price call.
Closing Note: Positioning and Volatility in AMD Stock
AMD stock sits at a crossroads between timeframes. The daily chart argues for patience while the hourly chart demands near-term caution. The daily chart’s neutral regime and intact position above the 200-day EMA argue for patience rather than panic. At the same time, the hourly chart’s clean bearish alignment argues for restraint. This is not a moment where the technical picture speaks with one voice.
In this context, elevated ATR readings on both the daily and hourly charts confirm that whichever direction resolves first, the move is likely to be volatile. The tight consolidation visible on the 15-minute chart, with price parked at the pivot, suggests the market is pausing rather than deciding. Given the mixed signals across timeframes and contrasting narratives in recent news, uncertainty remains the dominant condition.
FAQ
What is the current trend for AMD stock?
AMD stock’s daily structure is neutral following a sharp pullback. Price at 466.42 sits below both the 20-day EMA at 491.56 and the 50-day EMA at 486.70. However, the 200-day EMA at 362.07 remains well below current levels, keeping the long-term uptrend intact.
What are the key support levels to watch for AMD stock?
The immediate daily pivot stands at 471.99, with support at 456.98. On the hourly chart, the pivot sits at 466.85 with support at 465.38. A break below 456.98 would signal a deeper pullback and a potential challenge to the broader uptrend structure.
Is AMD stock a buy at current levels?
The technical picture is split. The daily chart’s position above the 200-day EMA and neutral RSI at 44.16 suggest patience rather than urgency. However, the hourly chart’s full bearish EMA alignment warns against immediate entry. Elevated ATR readings across timeframes signal that any directional move will likely be volatile rather than gradual.
What is driving the recent weakness in AMD stock?
Recent weakness reflects a combination of technical selling pressure and fundamental concerns. AMD has forecast soft demand from gaming and PC markets, and the stock fell 3.71% in a session tied to that cautious outlook. Meanwhile, Cathie Wood’s ARK sold AMD stock, a rotation some traders interpret as reduced institutional enthusiasm.
Disclaimer: This article is for informational purposes only and does not constitute financial advice, an investment recommendation, or a solicitation to buy or sell any financial instrument or cryptocurrency. The analysis provided is not indicative of future results. Investing in crypto assets and financial markets carries a high risk of capital loss. Always do your own research (DYOR) and consult a qualified financial advisor before making any decision.
Article produced with the assistance of artificial intelligence and reviewed by the editorial team.






 English (US) ·