
 1 hour ago
15
1 hour ago
15
Intel stock is trading through one of its most volatile stretches in months. The daily candle closed at $92.80 after opening at $97.18, within a range of $91.28 to $98.20. The wide range lines up with a $20 billion secondary offering at $95 and insider buying from CEO Lip-Bu Tan.
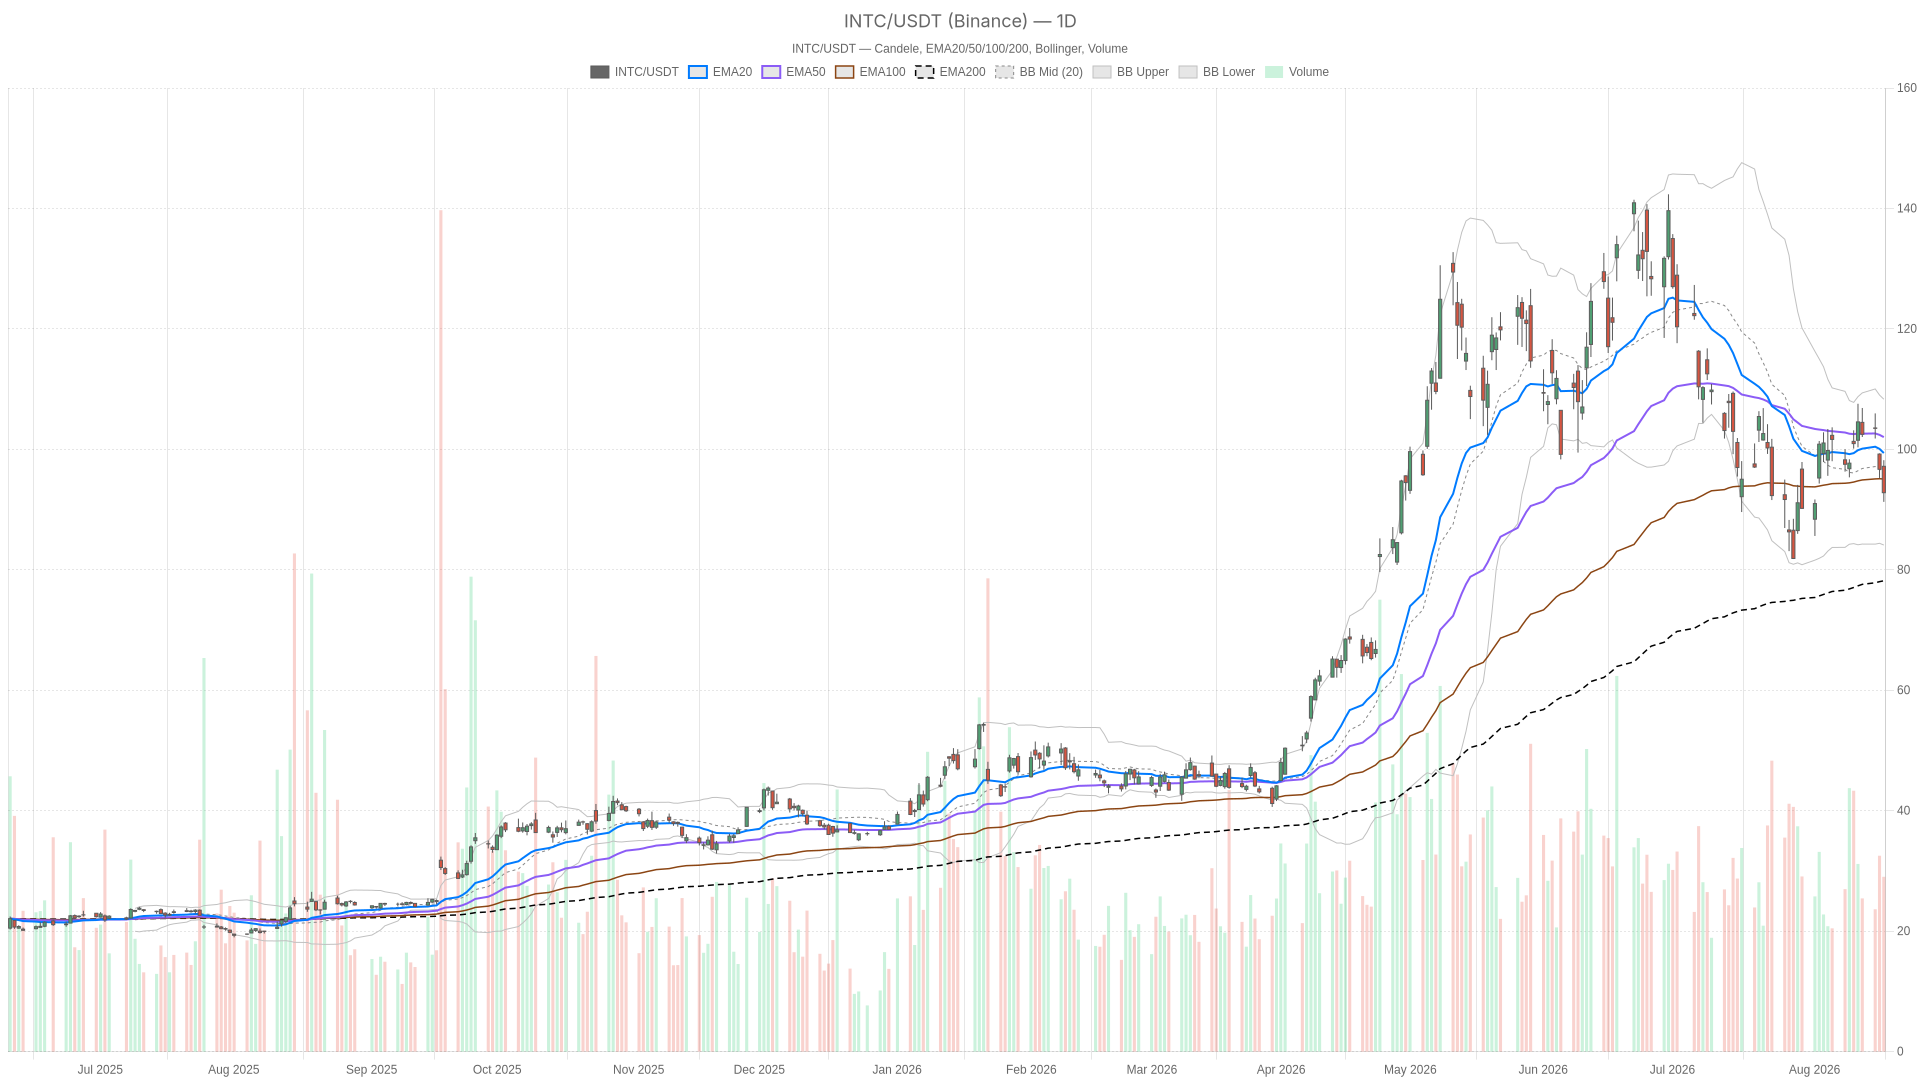 INTC — daily chart with candlesticks, EMA20/EMA50 and volume.
Key takeaways
- Intel stock closed at $92.80 on the daily candle, down from a $97.18 open, within a session range of $91.28 to $98.20.
- The stock trades below its 20-day EMA at 99.39 and 50-day EMA at 102.03, while the 200-day EMA at 78.18 keeps the longer uptrend intact.
- A $20 billion secondary offering priced at $95 per share adds fresh dilution pressure.
- CEO Lip-Bu Tan bought roughly $10 million of Intel stock at $95 and added another 105,000 shares.
- Daily RSI14 reads 41.98, neutral rather than oversold, while ATR14 has jumped to 6.27 on elevated volatility.
Daily Chart: Intel Stock in a Sharp Correction, Not (Yet) a Trend Break
On the daily timeframe, Intel stock is correcting hard, but the chart has not yet broken the longer-term uptrend. Price sits below the 20-day EMA at 99.39 and the 50-day EMA at 102.03, which places the stock in short-term bearish territory. However, the 200-day EMA remains far below at 78.18, meaning the broader structure built over recent months is still intact.
Momentum, Volatility, and Pivot Levels
RSI14 on the daily reads 41.98, a neutral reading rather than oversold. That leaves room for the stock to fall further before momentum reaches exhaustion. The MACD line sits at -1.79 against a signal line of -2.46, with the histogram at 0.67. That positive histogram reading, despite both lines being negative, hints that the pace of daily selling may be decelerating.
Bollinger Bands show the mid-line at 96.22 and the lower band at 84.11. Price is sitting in the lower half of that range without touching the extreme. ATR14 has jumped to 6.27, confirming that volatility has expanded sharply alongside the news flow. Daily pivot levels put the pivot point at 94.09 and S1 at 89.99. The close of 92.80 sits below the pivot and closer to support. Overall, the daily structure shows a genuine correction still operating inside a larger uptrend.
1H Timeframe: Confirming Near-Term Weakness in Intel Stock
The 1-hour chart confirms near-term weakness in Intel stock. Its EMA stack is fully bearish. The 20-period EMA at 96.43 sits below the 50-period at 98.63, which sits below the 200-period at 102.15. Price at 92.87 is trading beneath all three. The regime classification on this timeframe is explicitly bearish, and RSI14 at 28.31 is approaching oversold territory. Meanwhile, the MACD histogram on the 1H chart reads -0.39, and it is widening rather than narrowing.
This creates a notable conflict with the daily picture. On the daily chart, the MACD histogram is improving, suggesting decelerating downside momentum. On the 1H chart, momentum is still accelerating to the downside. In other words, the near-term tape has not yet caught up with any potential stabilization on the higher timeframe. At this stage, Intel stock is being pulled by an hourly downtrend that remains active. The daily chart, however, shows early signs of losing bearish steam.
15-Minute Execution Context
The 15-minute chart shows compressed volatility and price coiling near pivot levels. ATR14 sits at just 0.47, and the Bollinger Bands have tightened. The upper band sits at 93.64 and the lower band at 92.79, around a mid-line of 93.21. Price is coiling right at the pivot cluster, with the pivot point at 92.94, R1 at 93.22, and S1 at 92.59. The MACD histogram here is slightly positive at 0.15, a small tell that short-term sellers may be losing some control. For execution on this timeframe, the key levels are a break above 93.22 versus a slip below 92.59. Either move would likely set the tone for the next few hours.
News Flow: Dilution, Competition, and an Intel Stock Counter-Signal
The news flow behind Intel stock mixes dilution and competitive pressure with insider buying. Intel completed a $20 billion follow-on equity offering of over 210 million shares at $95 each. That deal directly dilutes existing shareholders and has been cited as a factor behind a reported 32% plunge in the stock. At the same time, Intel shares fell alongside AMD. A new partnership between Google and Marvell Technology for custom AI chip development raised concerns about shifting market share in the AI silicon race.
On the other hand, insider activity tells a different story. CEO Lip-Bu Tan bought roughly $10 million worth of Intel stock earlier this month at $95 a share. That is the same level as the secondary offering. He has since added another 105,000 shares. That is a meaningful vote of confidence from the person with the most visibility into the company.
Coverage has also pointed to Intel’s Q2 revenue rising 25% year over year, a sharp acceleration from the prior quarter. Some analysis has floated the idea that Intel could be as much as 81% undervalued following the share sale. None of this erases the near-term technical weakness. Still, it explains why the daily chart shows early momentum deceleration even as the 1H chart stays bearish.
Bullish Scenario for Intel Stock
A bullish case would require Intel stock to reclaim the daily pivot at 94.09 and push toward the 20-day EMA near 99.39. Recovering the 1H EMA stack would be an early confirmation signal. That starts with a close back above the hourly 20-period EMA at 96.43. Continued insider buying, sustained Q2-style revenue growth, and the undervaluation narrative could all support buyers around current levels. Therefore, a stabilization in the daily MACD histogram translating into an actual 1H momentum turn would be the technical trigger to watch.
Bearish Scenario for Intel Stock
In contrast, the bearish case stays intact as long as the 1H regime remains bearish and price holds below the daily pivot. A break of daily S1 at 89.99 would open the door toward the lower Bollinger Band at 84.11. That path becomes more likely if dilution-related selling and AI competitive concerns continue to weigh on sentiment. Persistent RSI weakness on the 1H chart, without a genuine bounce off the 28 level, would suggest sellers still have control. That would hold despite the daily chart’s tentative momentum shift.
Closing Take on Intel Stock
Intel stock sits at a crossroads between a corrective daily chart and a still-bearish hourly trend. The 15-minute chart is compressing into a tight range as it waits for direction. Volatility, measured by the sharp jump in ATR14, is elevated and unlikely to fade quickly. The mix of dilution, competitive headlines, and insider buying is hitting the tape at once. Positioning around this name requires patience. The long-term trend structure is not broken. Yet, the near-term path remains uncertain until the 1H momentum picture turns in line with the daily chart’s early signals.
FAQ
Is Intel stock breaking its long-term trend?
Not yet. Intel stock trades below its 20-day EMA at 99.39 and 50-day EMA at 102.03. The 200-day EMA, however, remains far below at 78.18, which keeps the longer-term uptrend structure intact. The daily chart is in a sharp correction, not a confirmed trend break.
What is the $20 billion offering doing to Intel stock?
The offering adds dilution pressure. Intel completed a $20 billion follow-on equity offering of over 210 million shares at $95 each. The deal has been cited as a factor behind a reported 32% plunge in the stock.
Why does insider buying matter here?
CEO Lip-Bu Tan bought roughly $10 million worth of Intel stock earlier this month at $95 a share and has since added another 105,000 shares. That is a vote of confidence that complicates the simple bearish reading tied to dilution.
What are the key levels to watch?
The daily pivot at 94.09 and daily S1 at 89.99 are central. A break of S1 could open the door toward the lower Bollinger Band at 84.11. On the 15-minute chart, 93.22 and 92.59 set the near-term tone.
Disclaimer: This article is for informational purposes only and does not constitute financial advice, an investment recommendation, or a solicitation to buy or sell any financial instrument or cryptocurrency. The analysis provided is not indicative of future results. Investing in crypto assets and financial markets carries a high risk of capital loss. Always do your own research (DYOR) and consult a qualified financial advisor before making any decision.
Article produced with the assistance of artificial intelligence and reviewed by the editorial team.




 English (US) ·