
 4 weeks ago
36
4 weeks ago
36
- Ethereum has rebounded above $1,780 as buying pressure continues to strengthen.
- Analysts believe ETH could see a larger Wave 2 recovery, even though the broader trend remains bearish.
- Technical indicators are pointing higher, but a major resistance level could decide Ethereum’s next move.
Ethereum is starting to regain momentum after several weeks of heavy selling, giving traders fresh hope that July could deliver a stronger recovery.
The second-largest cryptocurrency moved higher over the weekend as buyers stepped back into the market, helping ETH recover a portion of its recent losses. While the long-term trend still isn’t fully convincing, short-term sentiment has clearly improved.
At the time of writing, Ethereum is trading around $1,786.41, up 3.19% over the past 24 hours. Daily trading volume has climbed to roughly $15.08 billion, while its market capitalization sits near $215.30 billion, reflecting renewed interest from both traders and investors.
Ethereum Approaches a Critical Resistance Zone
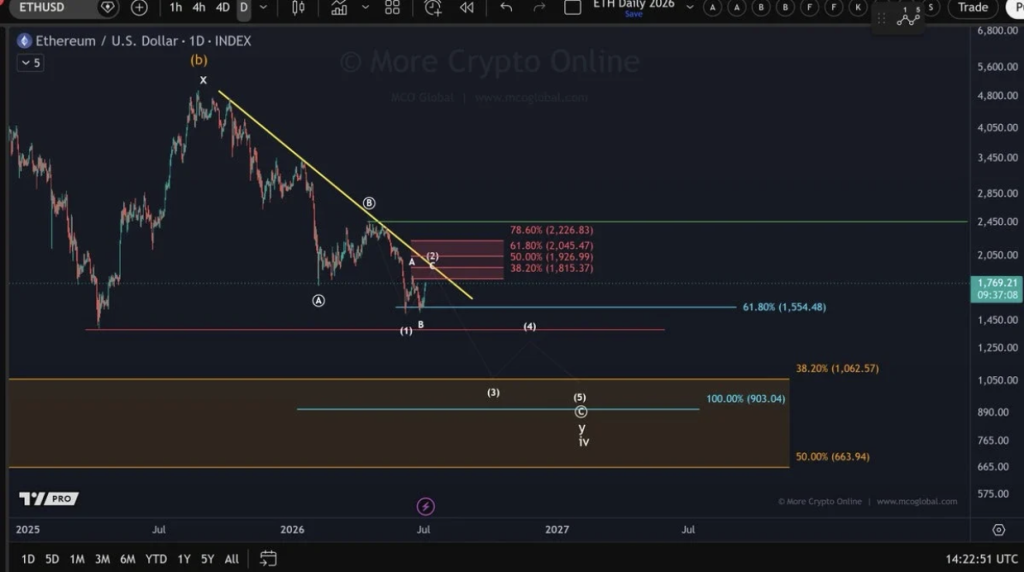
Crypto analyst More Crypto Online believes Ethereum is approaching one of its first major technical hurdles.
In an analysis shared on July 4, the analyst suggested that although the medium- and long-term outlook still leans bearish, ETH could be setting up for a sizable Wave 2 rally during July before the broader trend resumes.
That scenario isn’t unusual. Markets often experience sharp rebounds after extended declines, even when the larger trend hasn’t fully reversed.
For now, the focus is on resistance. If Ethereum manages to push above those key price levels, confidence could improve quickly, potentially attracting additional buyers into the market.
If not… the recovery may lose steam just as fast.
Technical Indicators Continue to Improve
Ethereum’s recent price action has been backed by improving technical signals rather than price alone.
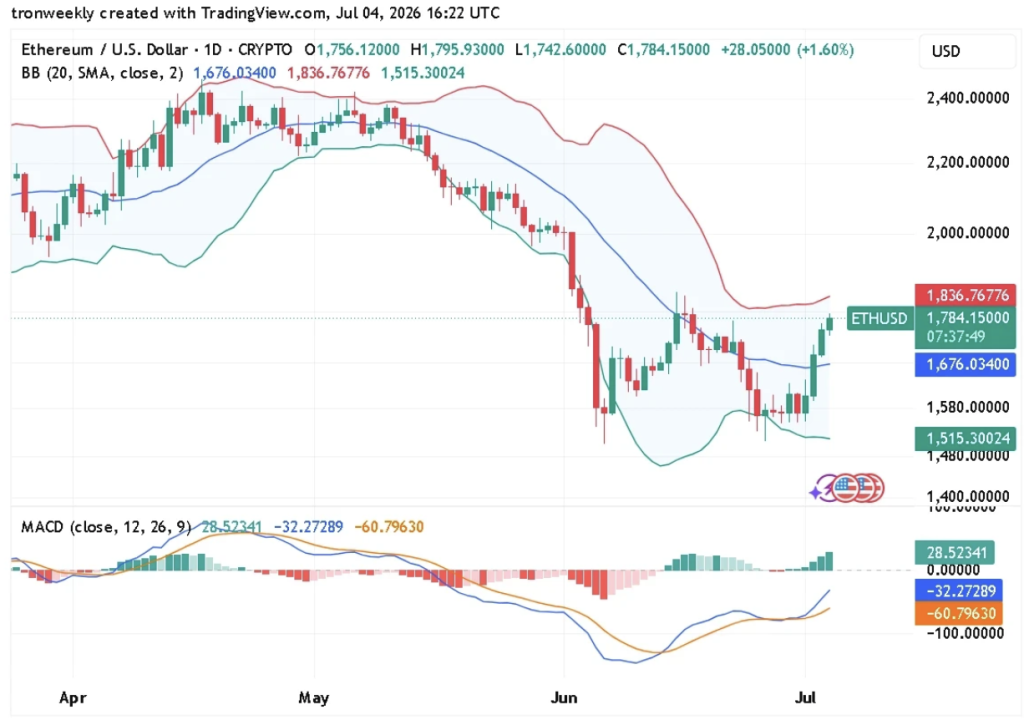
One of the clearest signs comes from the Bollinger Bands. ETH has climbed above the middle band, currently positioned around $1,676, suggesting buyers have regained short-term control.
The next important level sits near the upper Bollinger Band around $1,836.77. That’s where traders could begin taking profits, making it a key resistance area to watch over the coming sessions.
Meanwhile, the lower Bollinger Band remains near $1,515, highlighting how far Ethereum has already recovered from recent lows.
Momentum indicators are also turning more constructive.
The MACD (Moving Average Convergence Divergence) has crossed into bullish territory after the MACD line moved above the signal line. At the same time, the histogram has continued expanding, a sign that upward momentum is building instead of fading.
Taken together, these indicators suggest buyers currently have the upper hand, at least in the short term.
Can Ethereum Extend the Rally?
The next few trading sessions may prove especially important for Ethereum.
If bulls can break through the resistance near the upper Bollinger Band with strong trading volume, the current rebound could accelerate and open the door to a much larger recovery.
On the other hand, rejection at resistance would likely push ETH back into a period of sideways consolidation as traders lock in profits and wait for a stronger catalyst.
At the moment, technical indicators continue to favor the bulls, but one strong move above resistance is still needed before investors can confidently talk about a broader trend reversal.
For now, Ethereum appears to be building momentum—whether that momentum turns into a sustained breakout is the question the market is about to answer.
Disclaimer: BlockNews provides independent reporting on crypto, blockchain, and digital finance. All content is for informational purposes only and does not constitute financial advice. Readers should do their own research before making investment decisions. Some articles may use AI tools to assist in drafting, but every piece is reviewed and edited by our editorial team of experienced crypto writers and analysts before publication.


 English (US) ·