BTC $81,681
  ETH $2,403
  USDT $0.9989
  BNB $744.29
  XRP $1.32
  USDC $0.9995
  SOL $104.36
  TRX $0.3296
  FIGR_HELOC $1.03
 ZEC $1,227
 Peter Brandt says XRP charts alone give him reason to make a bet
The veteran trader flags a possible inverse head-and-shoulders pattern near $1.52 while keeping his distance from XRP's strongest supporters.
Key takeaways
- Peter Brandt said the XRP charts alone have always been enough reason for him to make a bet, and that it is not necessary to be a certified cult member to be an interested owner of XRP.
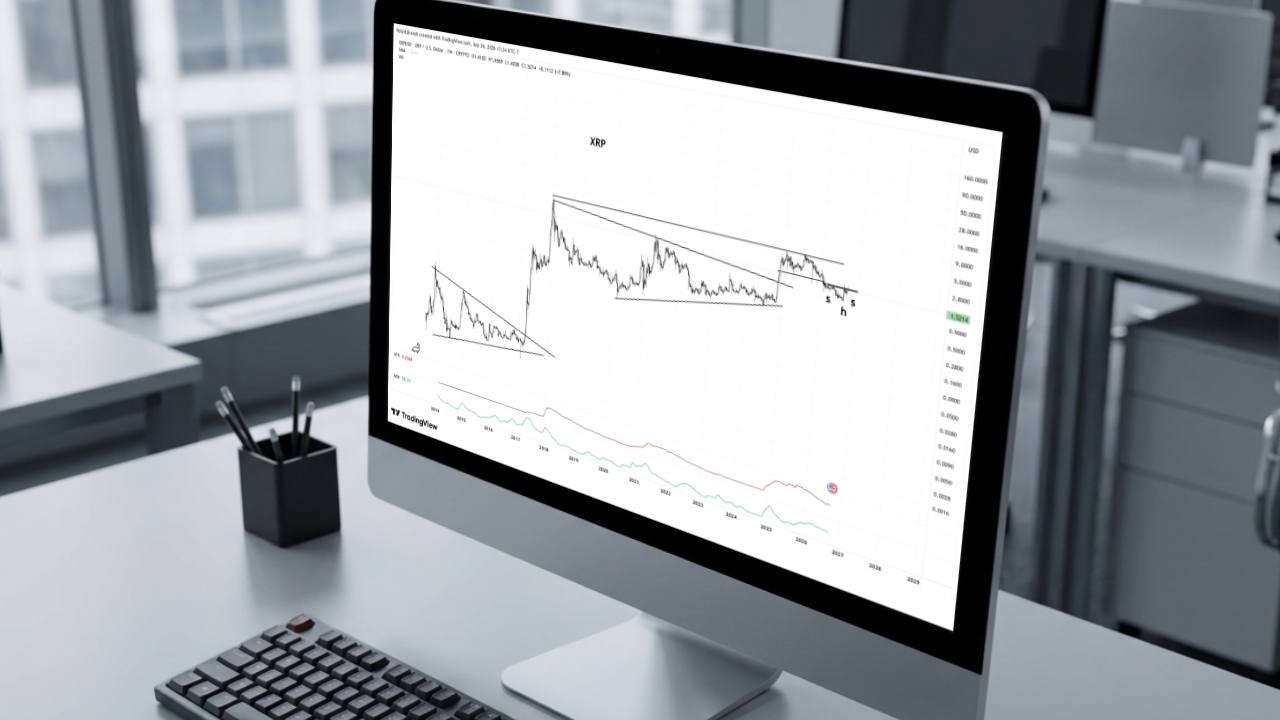
- His latest chart shows a possible inverse head-and-shoulders pattern near a $1.50-$1.55 neckline, with XRP at about $1.5214 after a weekly gain of 7.89%.
What happened
Peter Brandt says XRP charts alone give him reason to consider a trade, even as he questions the devotion of some holders. In a Sept. 26 post on X he wrote that it is not necessary to be a certified cult member to be an interested owner of XRP, and that the charts alone have always been enough reason for him to make a bet.
His latest weekly chart highlights a possible inverse head-and-shoulders structure near a neckline around $1.50 to $1.55. The chart places XRP at about $1.5214, after a weekly candle that opened at $1.4102, reached $1.6569 and gained 7.89%. XRP is testing that neckline rather than trading decisively above it, and it trades above the chart's weekly simple moving average near $1.3244.
Why it matters
Brandt's interest rests on classical chart formations rather than on the case XRP supporters make for the token. He entered commodity markets in 1976 and founded the trading firm Factor Trading in 1980, and he has used classical price charts that track recurring formations in historical prices throughout his career.
The $1.50-$1.55 zone matters twice: it is both the immediate neckline of the possible pattern and a horizontal level XRP is attempting to reclaim after its 2026 decline. Under classical chart analysis, the pattern would need a sustained break above the neckline before it could be considered confirmed.
Brandt's earlier chart work also shapes how readers read this post. A Sept. 21 long-term chart indicated a possible advance to $5.40 when XRP traded near $1.54, but the Sept. 26 post does not repeat that figure as a new target or set a timetable.
What the data shows
- XRP's reference price on Brandt's chart is about $1.5214.
- The weekly candle opened at $1.4102 and reached $1.6569, a gain of 7.89%.
- The neckline sits around $1.50-$1.55.
- A conventional measured move lands around $2.05-$2.10 if the structure confirms.
- The chart shows an ADX reading of 28.74.
- The chart's ATR is 0.2369, roughly 15.6% of the $1.5214 reference price.
- XRP trades above the weekly simple moving average near $1.3244.
- Santiment counted 1,917 transfers worth at least $100,000 and 3,647 new wallets during the earlier rise.
- XRP climbed above $1.60 on Sept. 22 before retreating in the Sept. 26 image.
- The upper boundary of the post-breakout range sits around $3.30-$3.40.
Background
The chart spans more than a decade. On the left, XRP's price action between roughly 2014 and 2017 shows a tightening structure formed by descending resistance and rising support, and XRP eventually broke out of that formation during the 2017 market expansion.
A second structure followed the 2018 peak, with a descending upper trendline and a rising lower trendline beginning around 2020. Those boundaries converged for several years before XRP broke above the descending resistance during its late-2024 rally, after which it advanced into a broad range with an upper boundary around $3.30-$3.40.
This is not the first time Brandt has discussed XRP through price patterns. In November 2024 he called a narrowing pattern a massive coil and said he held no XRP position that would benefit from a price rise. Separately, Evernorth plans to feature XRP community members in a campaign tied to its proposed Nasdaq listing.
What is still unclear
- Whether the inverse head-and-shoulders pattern confirms depends on a sustained break above the $1.50-$1.55 neckline.
- Brandt said in November 2024 that he held no XRP position and had no plans to buy, that statement described his position then, not necessarily now.
- The chart mixes a multi-year formation with a nearer pullback, and longer and shorter views emphasize different price movements.
Questions readers ask
Did Peter Brandt say he would buy XRP?
He said the charts alone have always been enough reason for his team to make a bet, and that investors do not need to be a certified cult member to be interested in XRP. He has also distinguished a public chart call from a completed trade, saying claims about executed trades need evidence beyond an X post.
What chart pattern is Brandt watching on XRP?
His chart highlights a possible inverse head-and-shoulders structure with a horizontal neckline around $1.50-$1.55, and XRP is testing that level rather than trading decisively above it. The measured-move area around $2.05-$2.10 is a technical calculation from the pattern, not a target stated on his chart.
What was Brandt's earlier XRP projection?
A Sept. 21 long-term chart indicated a possible advance to $5.40 while XRP traded near $1.54. The Sept. 26 post did not repeat $5.40 as a new target or set a timetable.
Where was XRP trading when Brandt posted?
XRP stood near $1.52, below its $1.66 weekly high but up about 7.9% for the week, with Brandt's chart placing it at approximately $1.5214.