BTC $77,681
 ETH $2,300
 MGLOEURO $111,813
 USDT $0.9987
 BNB $701.08
 XRP $1.29
 USDC $0.9994
 SOL $93.36
 TRX $0.3217
 FIGR_HELOC $1.07
Markets · Explained
Coinbase data shows XRP options pricing an 8.7% swing by Nov. 8
Implied volatility tracked by Coinbase Markets puts XRP level with Solana for the largest expected seven-day move among four major assets.

Key takeaways
- Largest relative premium. XRP's implied move is roughly 1.76 times its 4.9% historical median, a wider gap than Solana, Ethereum or Bitcoin show against their own histories.
- Direction unknown. The 8.7% reading reflects how much movement options traders expect, not whether the price will rise or fall.
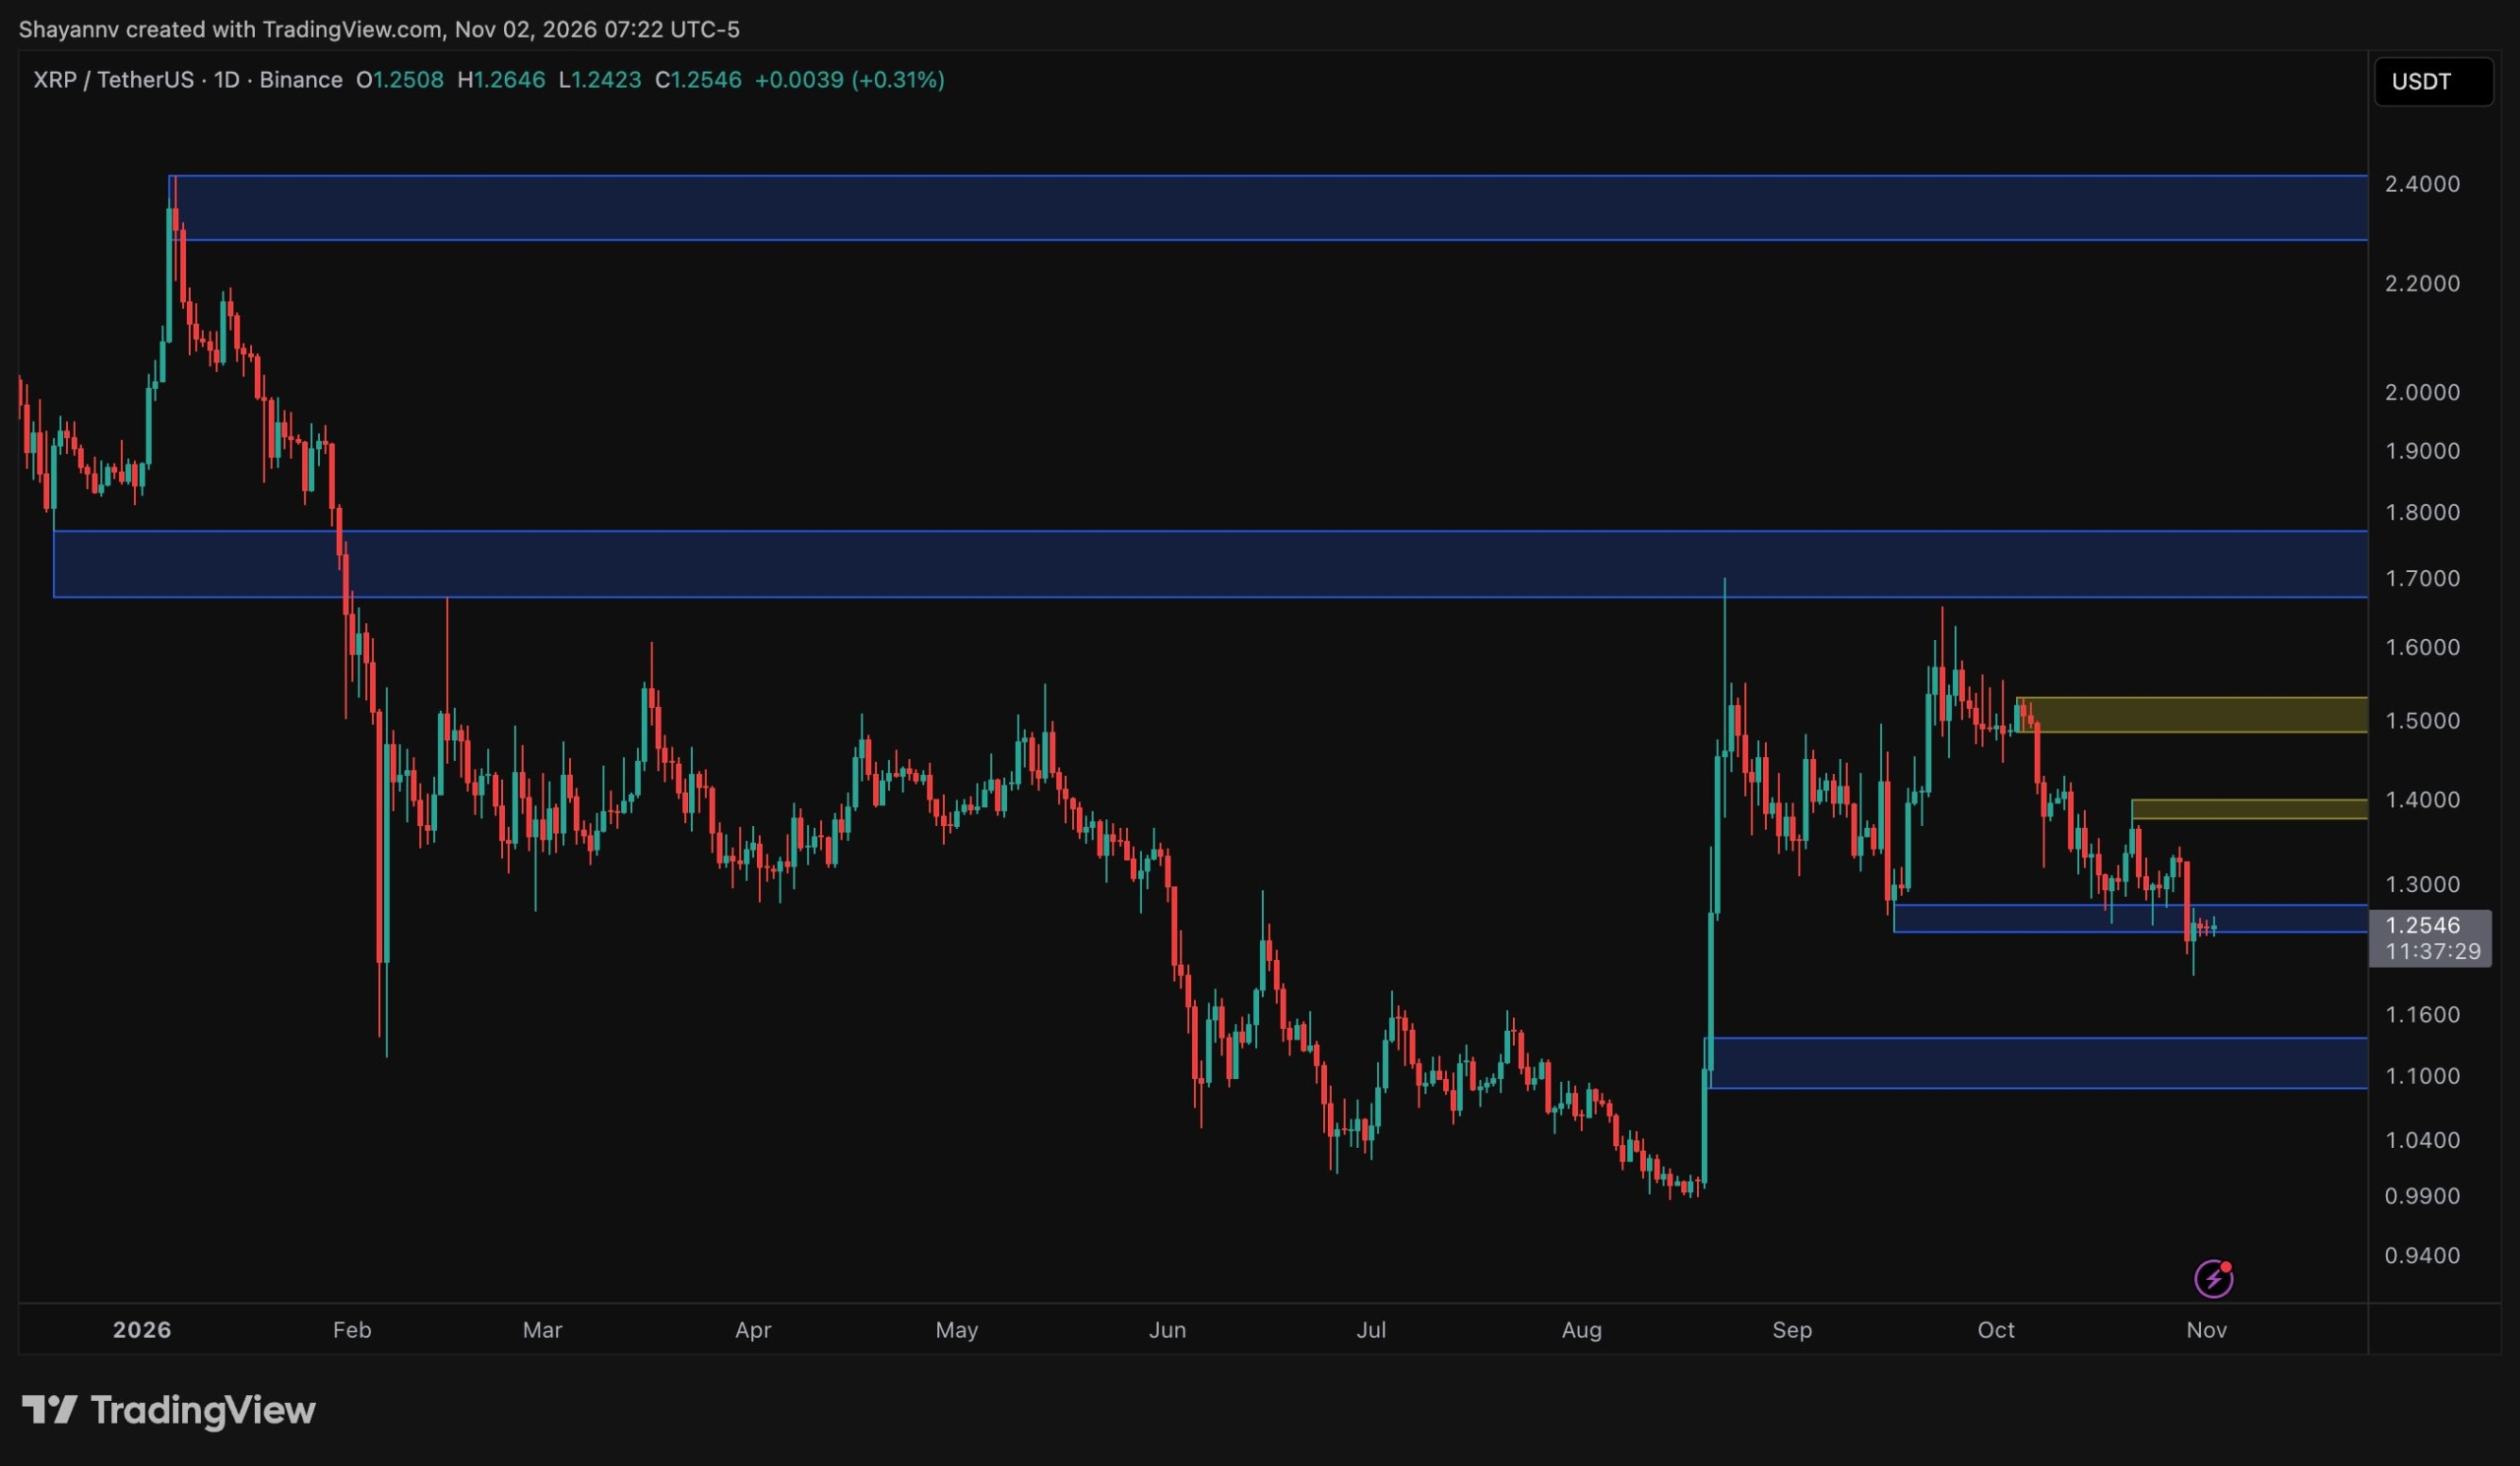
- Technical backdrop. XRP was trading near $1.25, close to the $1.24-$1.25 zone that recent technical coverage flagged as a possible bottoming area.
What happened
Options markets tracked by Coinbase Markets are pricing an approximately 8.7% swing in either direction for XRP through Nov. 8, according to data reported by The Crypto Basic and U.Today. That places XRP level with Solana for the largest expected seven-day move among the four major crypto assets in the dataset.
The same reading puts Ethereum at 7.7% and Bitcoin at 5.8%, making Bitcoin the asset with the smallest implied move of the group. XRP was trading near $1.25 at the time of reporting, close to the $1.24-$1.25 support band that has featured in recent technical analysis.
Coinbase derives the expected move from at-the-money implied volatility and the time left before the Nov. 8 expiry, using market data as of Nov. 1. The figure describes the size of a potential move rather than its direction, so a sharp decline would satisfy the calculation as readily as a sharp advance.
First $1.52Latest $1.28-15.8% over the period
Points are daily observations, not closing prices.
Why it matters
The more distinctive signal is how far XRP's options pricing sits above its own typical behaviour. Coinbase data places XRP's median seven-day absolute move at 4.9%, which means the current 8.7% implied figure carries a premium of about 1.76 times its historical median. Coinbase identified that as the widest relative premium among XRP, Solana, Ethereum and Bitcoin.
The comparison is starkest against Solana, which shares the same 8.7% implied move but has a much higher historical median of 6.5%, leaving its ratio at about 1.34 times. Ethereum's 7.7% implied move works out to roughly 1.51 times its 5.1% median, while Bitcoin's 5.8% reading is about 1.66 times its 3.5% median. All four markets are therefore pricing more movement than usual; XRP simply departs furthest from its own norm.
What the data shows
The gap between XRP's implied and historical figures is 3.8 percentage points, the largest absolute difference among the four assets charted. Recalculating from the rounded chart figures gives a ratio of about 1.78, while Coinbase cites 1.76, a difference the report attributes to the unrounded inputs behind the chart.
Using the $1.25 reference price, an 8.7% move would imply a range of roughly $1.14 to $1.36, with the upper bound near $1.36 and the lower near $1.14. Those levels are calculations based on the prevailing price, not price targets issued by Coinbase. The reading follows a one-standard-deviation convention, which under a normal distribution would correspond to roughly a 68% chance of the asset finishing inside the band, though U.Today noted this is a volatility framework rather than a forecast.
Background
Elevated volatility pricing is not new for XRP. In September, The Crypto Basic reported XRP options pricing an 8.9% move against a historical median of about 5%, a similarly wide premium. A separate options study from the same period found XRP call volatility carrying a substantial premium over puts. Recent coverage also identified the $1.24-$1.25 area as a potential bottoming zone, a level the asset was still trading near when the Coinbase data was compiled.
What is still unclear
The published ratio is not perfectly consistent across sources. Coinbase's stated 1.76x and a ratio of roughly 1.78 derived from the rounded chart numbers differ slightly, with the discrepancy attributed to unrounded inputs. The precise premium therefore depends on which figures are used, although the conclusion that XRP carries the widest relative premium in the group holds either way.
What to watch
The immediate question is whether the elevated expectation translates into an actual expansion of volatility before the Nov. 8 expiry, and in which direction any such expansion unfolds. Traders will also be watching whether XRP holds the $1.24-$1.25 support area that has framed recent setups, since a break or defence of that zone could shape how the options-implied range is tested.
Questions readers ask
Does the 8.7% figure mean XRP will rise or fall?
Neither. It reflects the size of the move options traders are pricing over the period, based on implied volatility, and applies equally to gains and losses.
Why is XRP's reading called the widest premium?
Because its implied move of 8.7% is about 1.76 times its own 4.9% median seven-day move, a larger multiple than Solana, Ethereum or Bitcoin record against their respective histories.
What is a one-standard-deviation move?
It is a volatility convention describing a range around the current price. Under a normal distribution it would imply roughly a 68% chance of finishing inside that band, but it is not a guarantee.