BTC $81,152
  ETH $2,367
  USDT $0.9991
  BNB $711.58
  XRP $1.27
  USDC $0.9997
  SOL $102.04
  TRX $0.3321
  FIGR_HELOC $1.08
  ZEC $1,086
 Bitcoin holds near $81,500 as short and long term signals split
Short-term averages lean bearish while longer-term structure still supports buyers, leaving BTC pinned between $81,000 and $82,500.
Key takeaways
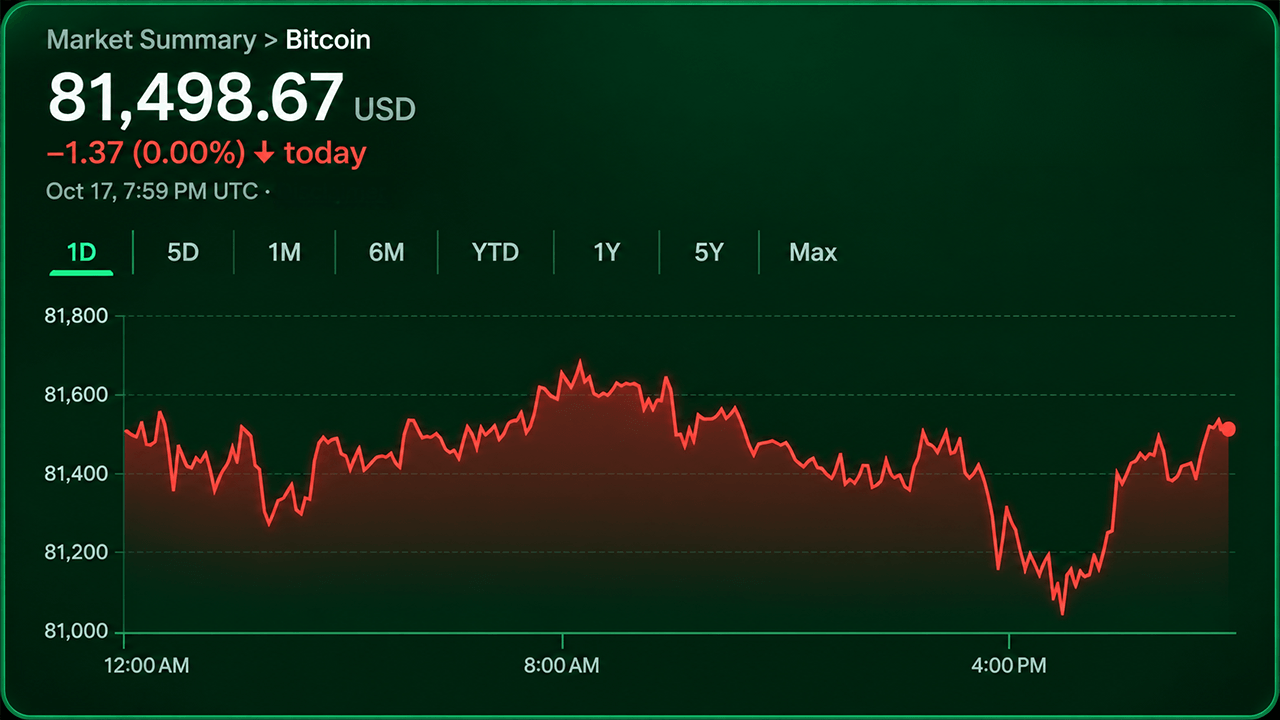
- A narrow range. Bitcoin's 24-hour range on Oct. 17 ran from $81,108.80 to $81,733.01, a tight band.
- Momentum is neutral. The RSI at 46 and Stochastic at 27 show neither overbought nor oversold conditions.
- Two levels to watch. Support sits near $81,000 and resistance near $82,500, with $79,694 below and $83,000 above.
What happened
Bitcoin traded near $81,500 on Oct. 17, 2026, with technical indicators giving competing signals. Shorter-term moving averages favored sellers, while longer-term averages continued to support buyers. The relative strength index stood at 46, and the broader technical rating remained neutral.
The market settled into a narrow holding pattern. Market capitalization was about $1.639 trillion, daily trading volume was $13.967 billion, and the 24-hour range ran from $81,108.80 to $81,733.01.
On the one-hour chart, bitcoin showed a tentative recovery from the recent $80,714 low, with higher lows suggesting buyers were trying to build a foothold around $81,000. Declining volume made that recovery less convincing. The four-hour chart showed consolidation after a rejection near $84,254.
A Sunday forecast put bitcoin near $81,600 on Oct. 18, with a 24-hour range from $81,100 to $81,750 and a market cap of about $1.64 trillion.
First $84.4KLatest $81K-4.0% over the period
Points are daily observations, not closing prices.
Why it matters
Support is clustered around $81,000 and resistance extends toward $82,500, so the next move either way matters for the recent consolidation. A recovery above $82,500 would begin repairing the immediate picture, though the $83,000 region is another obstacle.
Failure to preserve $81,000 would direct attention toward $79,694, an important structural support level. On the daily chart, bitcoin kept registering lower highs after its earlier advance to $87,374, a pattern consistent with weakening upward momentum.
What the data shows
- The Stochastic registered 27, the CCI sat at negative 116 and the ADX read 24.
- The MACD level of 80 carried a bearish signal, contrasting with positive classifications for momentum and bull bear power.
What is still unclear
- The reports describe a standoff without a decisive direction, and neither side had shown enough conviction to drive a clear move.
Questions readers ask
What is bitcoin's price right now?
Reports put bitcoin near $81,500 on Oct. 17, 2026, and a Sunday forecast placed it near $81,600 on Oct. 18.
What are the key bitcoin support and resistance levels?
Support is clustered around $81,000 and resistance extends toward $82,500. Below support, $79,694 is cited as a structural level, and above resistance the $83,000 region is another obstacle.
What does bitcoin's RSI show?
The RSI stood at 46, which indicates neither an overbought nor an oversold condition. The broader technical rating remained neutral.
Why is bitcoin's price stuck in a range?
Shorter-term moving averages favored sellers while longer-term averages supported buyers. The reports say neither side showed enough conviction for a decisive move.