BTC $80,183
 ETH $2,323
 USDT $0.9992
 BNB $738.08
 XRP $1.29
 USDC $0.9997
 SOL $101.08
 TRX $0.3307
 FIGR_HELOC $1.06
 ZEC $1,222
Bitcoin · Explained
Bitcoin slips below $80,000 as Quant rebounds and Ethereum weakens
Bitcoin traded near $79,947 after ETF flows turned negative, while Quant recovered from a weekend low and ether's momentum softened.

Key takeaways
- Below the line. BTC traded near $79,947 after a session low around $79,332, down about 1% over 24 hours, per the crypto.news snapshot.
- Quant outperforms. Quant closed at $189.95, a 6.15% gain on the session, after touching $200.03, though its daily MACD stayed bearish.
- Two catalysts ahead. The Fed meets October 27 and 28, with the September PCE inflation report scheduled for October 29.
What happened
Bitcoin traded near $79,947 on October 26 after touching an intraday low of roughly $79,332, down 1.02% over 24 hours in the snapshot published by crypto.news. The decline came after an attempt to recover toward $85,000 and accompanied about $17.55 billion in 24-hour trading volume. A separate October 26 review from The Crypto Basic put Sunday's close at $80,048.50, down 0.90%, within a session range of $79,750 to $80,919.20.
Ethereum finished Sunday at $2,326.50, 1.23% lower, after trading between $2,307.72 and $2,368.33. Its 14-day relative strength index eased to 34.07 from 36.24, still above the conventional oversold threshold of 30, and the latest four-hour candle closed at $2,299.93, beneath both the weekend low and the $2,313.42 level that had served as a base.
Quant was the outlier among the five assets covered. It closed at $189.95, up 6.15% on the session, after reaching $200.03; the upper wick showed the full advance was not retained. Hyperliquid slipped 0.43% to $76.27, and Internet Computer fell 1.50% to $2.625, its weakest close in the last 30 completed daily sessions.
First $84.4KLatest $80.4K-4.8% over the period
Points are daily observations, not closing prices.
Why it matters
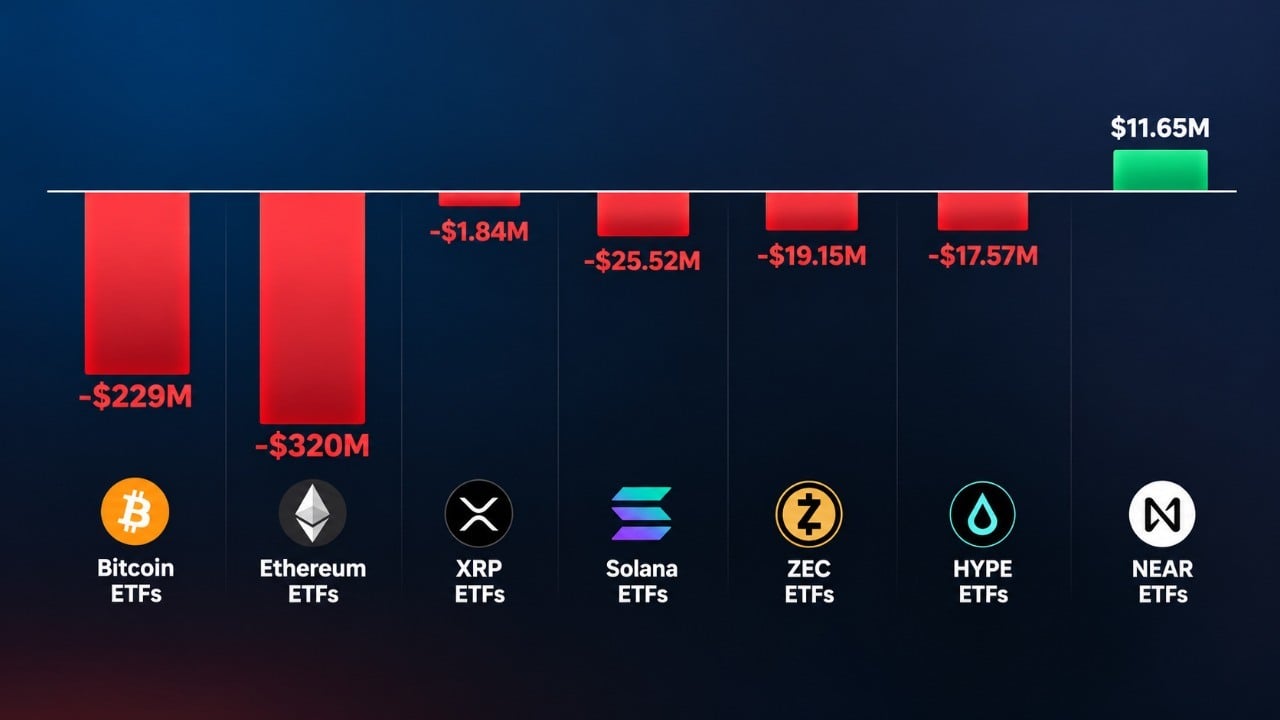
Spot Bitcoin ETF flows reversed just as the price failed to hold higher ground. Farside Investors data cited by crypto.news showed $526.7 million entering on October 19, $23.2 million on October 20 and $524.8 million on October 21, before outflows of $635.6 million and $137.9 million on October 22 and 23 removed $773.5 million. The funds still ended the five-session week $301.2 million ahead, but daily demand turned negative. CoinGlass figures in the same report recorded $154.23 million of crypto liquidations in one 24-hour window, including $117.99 million of longs and $32.94 million tied to Bitcoin positions. The timing adds weight: the Federal Reserve meets October 27 and 28, and the September PCE inflation report follows on October 29.
What the data shows
On the daily chart, Bollinger Bands built on a 20-day simple moving average put the midpoint at $82,255.37 and the lower band at $79,779.68; Sunday's low briefly pierced the band before price closed back inside it, and the latest four-hour candle settled at $79,489.60, below its own lower band. Glassnode's October 21 research located recent buying around $80,000 to $81,500 and a market-wide reference near $77,600, while Bitfinex's October 19 assessment flagged $79,821 as a possible liquidation trigger rather than a floor. Hyperliquid's 20-day exponential moving average at $80.93 sat below the 50-day at $81.76, a bearish crossover that took effect on the October 23 candle. Quant's daily MACD remained bearish, with the line at 0.90 against an 8.63 signal, though the histogram narrowed to -7.73 from -8.98.
Background
Bitcoin had already tested the $80,000 area on October 15, and Glassnode reported that buyers refilled bids within days, evidence that demand has appeared at that level before. Bitfinex analysts also noted futures open interest rose 4.3% between October 12 and 15 while the price fell, a combination that can leave leveraged longs exposed to forced closures. Quant's rebound followed further deterioration in its earlier structure: Saturday's $173.16 low sat below the $181.15 support tracked in the prior report, and the recovery only reclaimed Saturday's $184.46 high.
What is still unclear
Some figures differ between the two reports. The Crypto Basic headline described Quant as gaining 3.2%, while its analysis text recorded a 6.15% close-to-close advance to $189.95. Farside's table also carried one blank issuer entry for October 23, leaving its displayed totals open to revision, and liquidation dashboards cover different windows, exchanges and asset groups, which makes cross-report comparisons imprecise.
What to watch
Traders face two macro events in 24 hours: the Fed decision on October 28 and the PCE release the following day. On the charts, a daily close above $80,919.20 to $81,101 would recover the weekend highs and open the path toward $81,942.70 and the daily midpoint, while a close below $79,120.80 would confirm the loss of the weekend floor, with the September 8 low at $77,609.40 as the next older reference. Ethereum needs a close above $2,368.33 to $2,387.07 for stronger recovery evidence, and a close below $2,279.80 would mark a fresh low in its recent 60-day range. Quant faces resistance at $200.03 and support at $184.46; Internet Computer's immediate test is $2.572, with $2.435 below.
Questions readers ask
Did Bitcoin crash on October 26?
The reports describe a move below $80,000 rather than a crash. BTC traded near $79,947 with a session low around $79,332, roughly 1% lower over 24 hours.
Why did Quant rise while other assets fell?
The analysis does not assign a cause. It records a 6.15% close at $189.95 after a $200.03 high, which recovered Saturday's $184.46 high while the daily MACD stayed bearish.
Which levels are traders watching next?
For Bitcoin, $80,919.20 to $81,101 on the upside and $79,120.80 below; for Ethereum, $2,368.33 to $2,387.07 and $2,279.80; for Quant, $200.03 and $184.46; for Internet Computer, $2.572.