BTC $77,322
 ETH $2,305
 MGLOEURO $111,813
 USDT $0.9995
 BNB $695.27
 XRP $1.27
 USDC $0.9998
 SOL $91.52
 TRX $0.3173
 FIGR_HELOC $1.04
ETFs · Explained
Fidelity and BlackRock bitcoin ETFs diverge as BTC tops $80K
Spot bitcoin ETFs drew $75 million on Nov. 4 as Fidelity's FBTC outweighed BlackRock's IBIT outflows, while bitcoin rebounded above $80,000.
Key takeaways
- Split flows. Fidelity's FBTC took in about $237 million while BlackRock's IBIT lost about $201 million, leaving a modest net gain across the funds.
- Price rebound. Bitcoin recovered above $80,000 after a dip tied to the US midterm results, helped by ETF inflows, firmer stocks and short liquidations.
- Cautious signals. One analyst said the bottom looks in but put the odds of a new record high by July 2027 at 16%, while another said confirmed-bottom conditions are not yet met.
What happened
US spot bitcoin ETFs attracted about $75 million in net inflows on Nov. 4, according to Farside Investors data cited by CryptoSlate and Blockonomi, ending a run of three consecutive sessions of withdrawals. The positive total depended on Fidelity's FBTC overcoming another negative reading from BlackRock's IBIT.
FBTC recorded net inflows of roughly $237 million, while IBIT posted net outflows of about $201 million. ARK Invest's ARKB added about $20 million, Bitwise's BITB took in about $15 million and Invesco's BTCO added about $4 million. IBIT was the only fund with a negative reading that day, and seven funds showed no net change.
The reversal followed outflows of $643 million on Oct. 30, $399 million on Nov. 2 and $116 million on Nov. 3, a stretch that removed about $1.16 billion from the products. The Nov. 4 inflows recovered only a small part of that total.
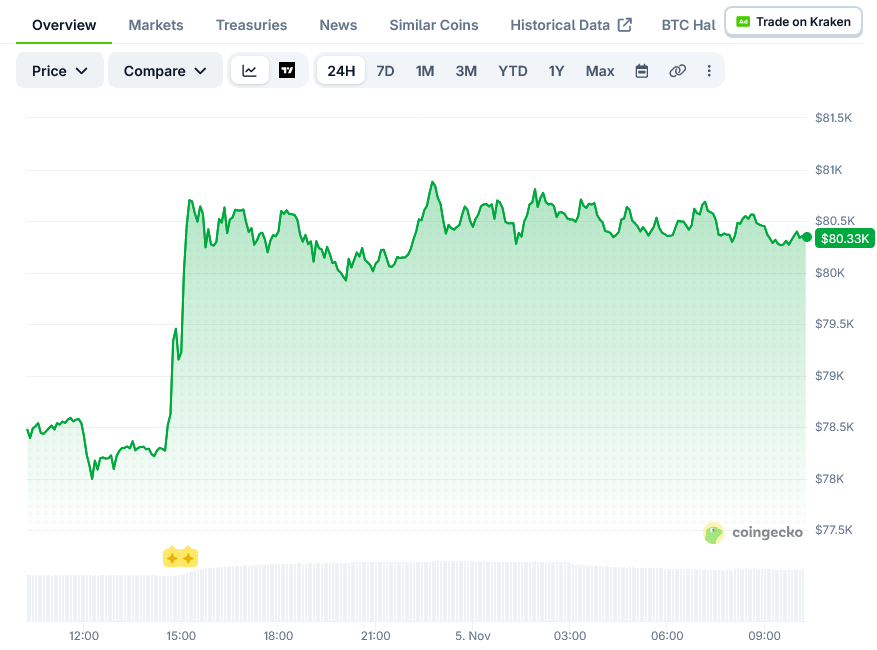
Bitcoin traded near $80,320 on Nov. 5, up more than 3% over 24 hours, after slipping toward $75,600 as US midterm election results came in on Nov. 3. The price briefly climbed above $81,000 before settling near $80,000, Blockonomi reported.
First $85.6KLatest $79.4K-7.2% over the period
Points are daily observations, not closing prices.
Why it matters
The session shows that demand across spot bitcoin ETFs is not uniform: money entering Fidelity's fund can offset withdrawals from the largest product, so a positive aggregate figure can mask opposing moves among issuers. IBIT had also recorded withdrawals on each of the three preceding sessions, meaning the aggregate reversal occurred while outflows from that fund continued.
For price watchers, the ETF flows arrived alongside a broader risk-asset recovery. Blockonomi reported that the S&P 500 rose about 1.6%, oil prices fell, and a weaker dollar and lower Treasury yields supported demand for risk assets. A short squeeze added to the move: CoinGlass data showed about $378 million in short positions liquidated within one hour, out of nearly $747 million in total liquidations.
What the data shows
On the daily chart, Blockonomi reported that BTC at around $80,688 sat above the middle Bollinger Band at $80,274, with the Relative Strength Index at 51.28, up from its moving average of 41.87. Immediate resistance was placed between $81,300 and $82,000, with the upper band near $84,240 beyond that; support was identified at the middle band, followed by the lower band near $76,308.
Gains spread across major coins. Ethereum rose almost 6% to about $2,425, XRP gained 3% to $1.31, Solana climbed 4% to $96 and BNB added 2% to around $710. Zcash led the group, jumping over 7% to nearly $1,320 on $1.2 billion in 24-hour trading volume.
Background
Crypto traders were initially uneasy after Democrats won control of both chambers of Congress in the midterms, since Democratic lawmakers could take a tougher approach to pending digital asset bills, according to Blockonomi. Markets steadied as investors weighed the results.
CryptoSlate's Nov. 4 report had described the three-session withdrawal streak using ETF data through Nov. 3 and identified subsequent flows as the next demand test. The completed Nov. 4 session provided a positive observation after that streak.
What is still unclear
Analysts disagree on whether the rebound marks a durable bottom. Crypto analyst Ted said bitcoin's ability to absorb negative news suggested the bottom is in, but he put the chance of a new all-time high by July 2027 at only 16%, adding that a record could come later that year. CryptoQuant contributor CryptoZeno said bitcoin has not yet reached conditions linked to a confirmed bottom, citing a Bitcoin Cycle Extremes Index reading of 15.8% on its 30-day moving average and a Cycle Extreme Oscillator below the 1.0 level tied to stronger activity in past cycles.
What to watch
Repeated positive sessions would show whether aggregate inflows persist. More funds recording inflows would indicate broader participation across products, while IBIT's next readings will show whether its withdrawals continue to offset money entering elsewhere.
Questions readers ask
How much did spot bitcoin ETFs take in on Nov. 4?
About $75 million in net inflows, according to Farside Investors data cited by CryptoSlate and Blockonomi.
Which funds drove the flows?
Fidelity's FBTC led with roughly $237 million in inflows, while BlackRock's IBIT was the only fund with outflows, at about $201 million.
Why did bitcoin rise above $80,000?
Blockonomi attributed the rebound to fresh ETF inflows, rising US stocks and a wave of forced short closures after a dip tied to the midterm results.