BTC $80,283
 ETH $2,323
 USDT $0.9994
 BNB $740.61
 XRP $1.30
 USDC $0.9999
 SOL $101.55
 TRX $0.3309
 FIGR_HELOC $1.06
 ZEC $1,237
Markets · Explained
Bitcoin risks $72,500 slide as $82,000 resistance caps recovery
Analysts point to a chart breakdown and resistance level that could extend Bitcoin's pullback from recent highs.
Key takeaways
- Technical breakdown. Bitcoin appears to have broken below a rising parallel channel on the 4-hour chart, a pattern that suggests the earlier upward structure has weakened.
- Whale accumulation. Large investors holding between 10 and 10,000 BTC accumulated nearly 90,000 coins in one month, reducing supply on the open market.
- Liquidity clusters matter. Multiple price levels contain concentrated liquidity that could influence Bitcoin's next move in either direction.
What happened
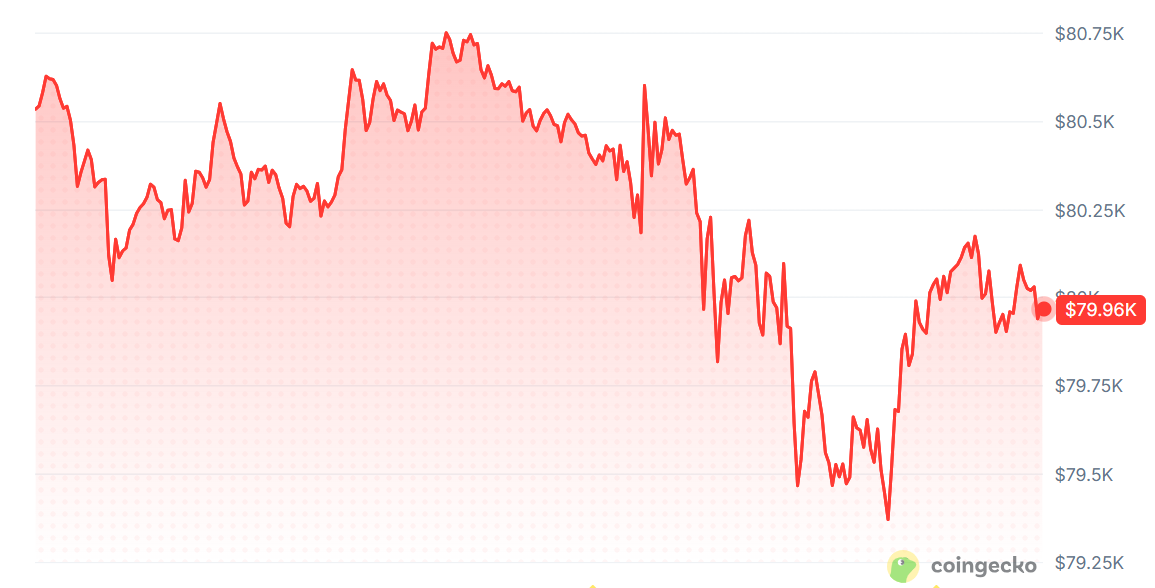
Bitcoin dropped below $80,000 this week after failing to reclaim $85,000, prompting multiple analysts to flag technical weakness. The primary cryptocurrency traded around $79,757 as of late October, down 0.74% over 24 hours and 3.22% across the previous seven days, according to CoinGecko data. Trading volume reached $18.3 billion in 24-hour activity.
Analyst Ali Charts identified a breakdown below a rising parallel channel on the 4-hour timeframe, a pattern that tracks price between two upward-sloping boundaries. When Bitcoin breaks below the lower boundary, it signals that the earlier upward structure has weakened. As long as $82,000 holds as resistance, Charts believes the correction could extend toward $72,500, roughly 9.1% below the recent price level.
Not all analysts expect extended downside. That Martini Guy flagged a large liquidity cluster just above $81,000 and noted that short liquidations in that zone could trigger an upside squeeze if Bitcoin advances. He cautioned, however, that nearby liquidity does not necessarily attract price or guarantee a reversal. The immediate test for bulls centers on reclaiming $81,000 and challenging $82,000 while defending the $79,000 area.
First $84.4KLatest $80.2K-5.0% over the period
Points are daily observations, not closing prices.
Why it matters
The distinction between resistance levels and buying opportunities shapes how traders approach the pullback. Some analysts view further weakness as a buying signal rather than a bearish outcome. Ali Charts described $72,500 as a zone where he would seek his next entry, framing the potential decline as an accumulation opportunity. This perspective reflects a longer-term bullish stance even amid near-term technical deterioration. For traders managing leveraged positions, the liquidity clusters identified by multiple analysts matter significantly, as concentrated positions can amplify price moves in either direction.
What the data shows
Multiple analysts have mapped Bitcoin's near-term price targets using technical analysis and liquidity data. The $82,000 level functions as the key resistance that would confirm extended downside if it fails to hold. Blockonomi reported that CoinAnk's three-day liquidation heatmap shows a dense overhead band stretched across $81,500, $82,000, while a lower concentration occupies $78,500, $79,000. According to CoinAnk, the recent decline had cleared liquidation concentrations from the middle of that range, leaving traders watching the remaining clusters for evidence of renewed pressure. Another analyst, identified as Sweep, noted that Bitcoin's daily Relative Strength Index has reached the same level it was at when the asset began rallying in August, suggesting the current pullback is consistent with typical bull market behavior.
Background
Bitcoin's recent weakness follows a period of strength that lifted the asset toward $85,000. According to CryptoPotato, whale activity during that rally signaled conviction among large holders. Forty newly created wallets withdrew over $770 million worth of Bitcoin between October 1 and October 23. More broadly, investors holding between 10 and 10,000 BTC accumulated nearly 90,000 coins in a single month prior to the recent pullback, reducing the supply available on the open market.
Some analysts also flagged macroeconomic timing as a consideration. Ali Martinez noted that US midterm elections are scheduled for November 3 and pointed to historical precedent. Following the elections in 2010, 2014, 2018, and 2022, Bitcoin fell 72%, 65%, 52%, and 27%, respectively. Martinez advised traders to consider taking some profits in late October and potentially re-entering at $73,000 after the November elections, suggesting the seasonal pattern could drive further volatility.
What to watch
Whether Bitcoin stabilizes above $82,000 or breaks toward $72,500 will depend on how institutional buyers respond to weakness and whether retail participants follow through with additional selling. The concentration of liquidity just above $81,000 could trigger short liquidations that accelerate a bounce, or price could simply pass through that zone without reversal. Traders should monitor whether the large-scale accumulation by whales translates into demand that prevents further capitulation, or whether technical breakdown signals genuine weakness requiring lower prices to attract fresh buyers.
Questions readers ask
What does breaking below a rising parallel channel mean?
A rising parallel channel tracks price between two upward-sloping boundaries. When price breaks below the lower boundary, it signals that the earlier upward structure has weakened, but it does not establish how far the correction will extend or guarantee that selling will continue.
Why do analysts mention liquidity clusters?
Liquidity clusters mark price levels where many trading orders sit. These concentrations can influence whether price accelerates through a level or reverses, particularly when leveraged positions are liquidated and force buying or selling.
How do whales accumulating coins affect Bitcoin's price?
When large holders accumulate coins, fewer coins remain available on the open market, which can reduce selling pressure and potentially boost confidence among smaller traders to bring fresh capital into the ecosystem.