BTC $75,767
 ETH $2,247
 MGLOEURO $111,813
 USDT $0.9994
 BNB $689.93
 XRP $1.25
 USDC $0.9998
 SOL $90.30
 TRX $0.3157
 FIGR_HELOC $1.04
Bitcoin · Explained
Bitcoin's push toward $80,000 stalls at technical resistance
Two analyses describe a sharp rebound from the mid-$70,000s that has yet to clear the moving averages and channel levels capping upside.

Key takeaways
- Stalled rally. Bitcoin bounced from below $76,000 toward $80,000 but has not cleared the resistance that capped the move.
- Two ceilings. The hourly 200 EMA and the four-hour moving-average zone are the barriers Bitcoinist identifies before any run at $80,000.
- On-chain signal. CryptoQuant's adjusted SOPR has eased to roughly 1.003, close to the level separating profit-taking from loss-selling.
What happened
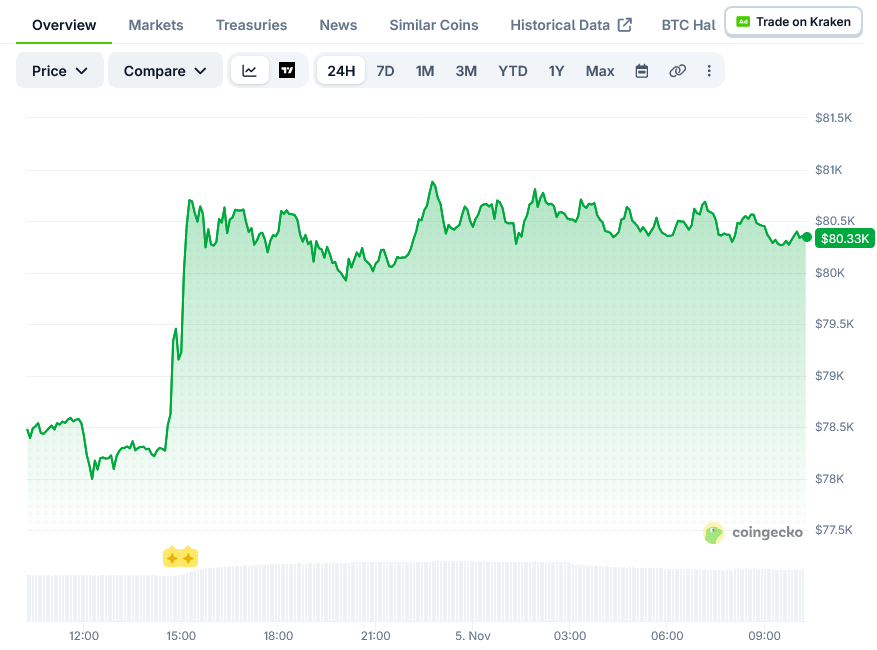
Bitcoin's advance toward $80,000 has lost momentum after a fast rebound from the mid-$70,000s, with two technical analyses published a day apart describing a market that recovered quickly but has not cleared the resistance overhead. Bitcoinist reported on November 4 that bitcoin briefly fell below $76,000 during the immediate reaction to the US midterm elections before recovering toward $78,000, a rebound of at least 2.6% from that reference level. CryptoPotato reported on November 5 that bitcoin was trading around $79.7K after a sharp rebound from the $75K region stalled near $80K.
Both outlets treat $80,000 as the level that matters most in the near term. Bitcoinist describes the psychological threshold as within reach from the $78,000 area, noting that a move between the two levels would equal roughly 2.56%. CryptoPotato places the same figure at the channel midline, saying the latest rebound was rejected where the upper trendline of a descending four-hour channel meets an $80K supply zone.
Neither report reads the bounce as a change in trend. Bitcoinist says the four-hour moving-average structure continues to cap price and that buyers have not regained control of the short-term trend, while CryptoPotato says the rejection keeps bitcoin inside a short-term corrective structure between demand below and resistance above.
First $85.6KLatest $79.4K-7.2% over the period
Points are daily observations, not closing prices.
Why it matters
The gap between a bounce and a breakout is the central point in both analyses. Bitcoinist argues that traders should separate a short-term recovery from a confirmed shift in market structure, and that a move above the four-hour resistance zone would be needed, ideally with improving volume, to make the bullish case stronger. CryptoPotato frames the same question in terms of the channel: reclaiming the midline could open the way back toward the $87K supply zone, while a decisive daily close below $75K would invalidate the demand block and put the channel floor near $73K in play. Bitcoinist also notes that leveraged positioning can magnify price swings in either direction.
What the data shows
CryptoPotato cites the Adjusted Spent Output Profit Ratio, a CryptoQuant metric that shows whether coins moved on-chain are spent at a profit or a loss, excluding outputs younger than one hour. Readings above 1 indicate profit-taking; below 1 indicates loss-selling. The 30-day exponential moving average of the metric stayed above 1 through the 2024-2025 uptrend, fell below it in early 2026 and bottomed near 0.98 as bitcoin dropped toward $60K, then reclaimed the threshold in August and peaked around 1.013 in October. It has since slid to about 1.003. Bitcoinist, meanwhile, points to the hourly 200-period exponential moving average as the first indicator to watch, followed by the four-hour and then the daily moving-average structure.
Background
Bitcoin has been trading inside an ascending channel since its June lows near $58K, according to CryptoPotato. The price was rejected twice at the channel's upper boundary around $87K, in September and early October, then formed lower highs and slipped below the midpoint late last month. The pullback carried into a $75K-$78K demand zone that had preceded the September rally to $87K. On the four-hour chart, a descending channel has been in place since the late-September highs near $87K, with the upper boundary capping every rebound, including an October spike into the $85K supply area.
What to watch
Bitcoinist is watching whether buyers can establish the hourly 200 EMA as support, whether trading volume strengthens and whether the four-hour resistance zone begins to weaken; it also flags institutional demand and risk appetite as context. CryptoPotato is focused on whether bitcoin can hold above the $75K-$76K area, with a break higher opening $85K and then $87K, and on whether the adjusted SOPR holds above 1. That outlet cautions the metric alone does not confirm direction, but that a drop below 1 combined with a daily close under $75K would strengthen the bearish case.
Questions readers ask
What price levels are in focus for bitcoin?
Bitcoinist highlights $78,000 and the psychological $80,000 level, with the hourly 200 EMA and four-hour moving averages overhead. CryptoPotato points to the $80K channel midline as resistance, a $75K-$78K demand zone below, and $87K as the supply area above.
What would confirm a recovery?
Bitcoinist wants to see bitcoin reclaim the hourly 200 EMA, retest it as support and print higher lows, followed by a break of four-hour resistance on stronger volume. CryptoPotato says a sustained move above the $80K confluence could open $85K and then $87K.
What would weaken the rebound case?
CryptoPotato says a decisive daily close below $75K would invalidate the order block, leaving about $73K as support, with a break there raising the risk of a move toward the low $60K region. A sustained SOPR reading below 1 alongside such a close would reinforce the bearish view.