BTC $66,063
 EQQQQ $655.75 Last updated 8 Nov 2026, 12:03 UTC
 ETH $1,856
 MGLOEURO $111,813
 USDT $0.9994
 BNB $600.42
 USDC $0.9997
 XRP $0.9841
 SOL $74.18
 TRX $0.3100
Markets · Explained
XRP tests $0.99 support as analysts warn of potential drop to $0.80
XRP fell below $1 for the first time since August as liquidations and broader market weakness pressure the token near a critical support level.
Key takeaways
- Critical support test. XRP is trading near $0.99, a key technical level that could determine whether selling pressure continues or reverses. A breakdown could open the door to further declines toward $0.80.
- ETF outflows signal weakness. US spot XRP exchange-traded funds recorded $1.09 million in net outflows on November 13, with Grayscale's GXRP shedding $5.54 million, adding to bearish sentiment.
- Macro headwinds persist. Rising expectations for higher US interest rates and broader cryptocurrency market losses are fueling liquidations in leveraged positions, weighing on risk assets like XRP.
What happened
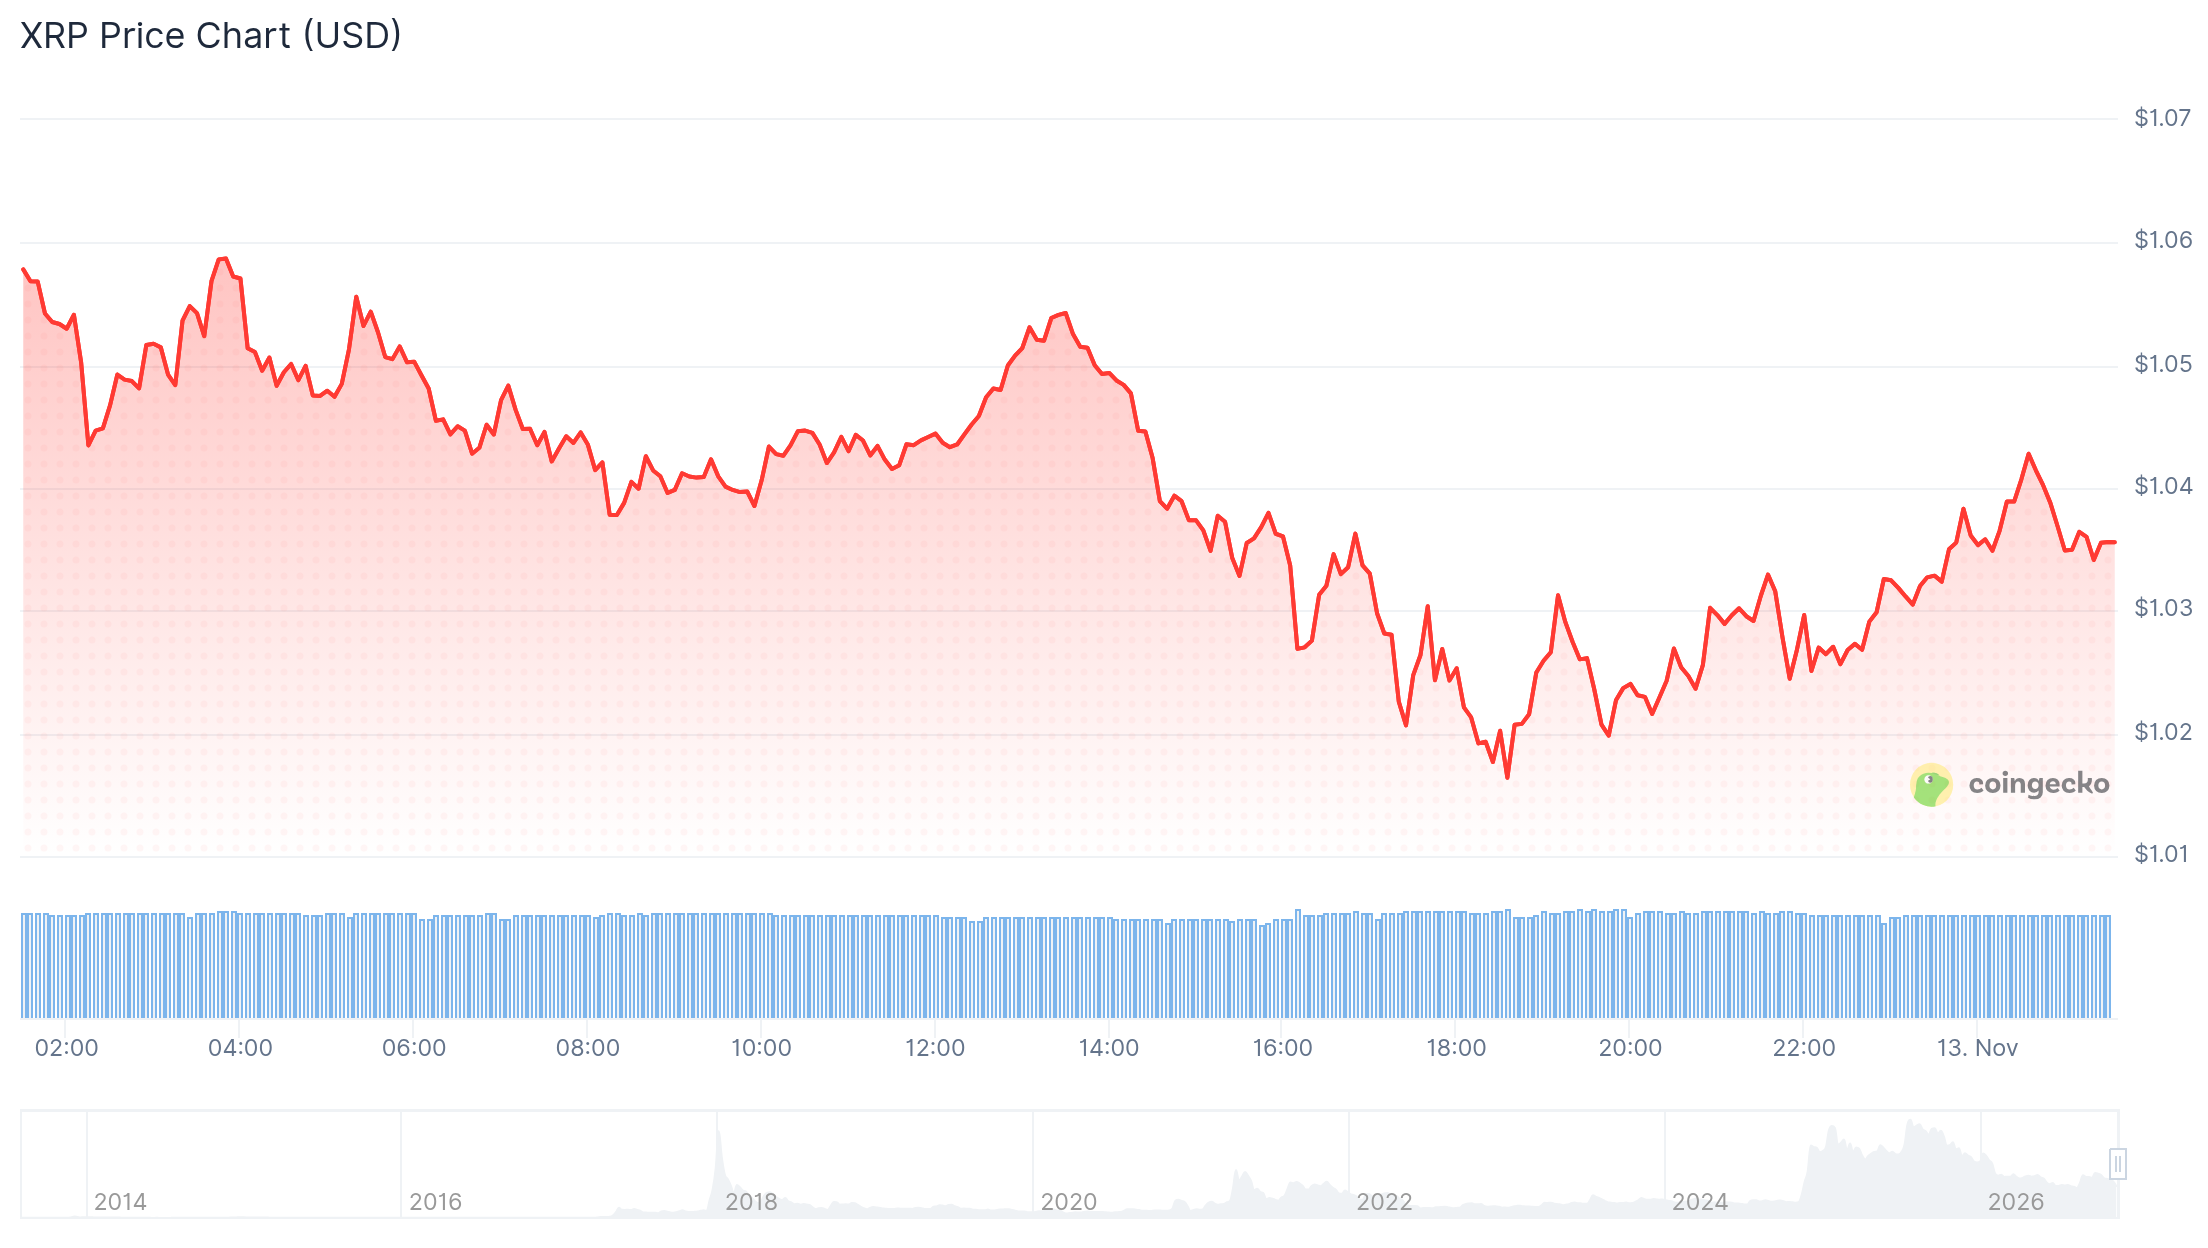
XRP traded below $1 for the first time since August as selling pressure intensified across cryptocurrency markets. According to CoinGape reporting from November 13 and 14, the token reached a low of $0.9818 and traded near $0.9923 by Saturday, down roughly 16% for November following an earlier 16% decline in October.
The slide brought XRP to a critical technical boundary. Analyst Ali Charts identified a downward-sloping channel with support near $0.99 as the token's immediate focal point. Charts noted that XRP had reversed sharply after failing to break through $1.55 resistance at the upper boundary of this channel. According to multiple reports including Blockonomi and Finbold, Charts warned that a sustained break below $0.99 could extend the correction to $0.80, representing roughly a 19% further decline from Saturday's price.
Liquidations and broader market weakness contributed to the move. The global cryptocurrency market fell 2.25% over 24 hours as total value contracted to $2.27 trillion. Bitcoin dropped 3.34% below $69,000, while Ether fell through $1,900. Higher expectations for US Federal Reserve rate increases in December, with Kalshi traders pricing in an 89% probability of a 25 basis point increase, made speculative assets less attractive relative to interest-bearing investments.
First $1.33Latest $0.9904-25.5% over the period
Points are daily observations, not closing prices.
Why it matters
XRP's price action carries significance for the broader cryptocurrency market. A sustained break below the $0.99 support level could accelerate the token's decline and trigger further liquidations in leveraged positions, potentially amplifying downward pressure across digital assets. Conversely, a hold at this level could stabilize sentiment and test competing technical scenarios. Crypto With Gopal noted that holding the $1.00 zone could signal a potential double-bottom formation and trigger a bullish reversal, while a breakdown would strengthen the bearish case outlined by Ali Charts. The immediate technical battleground around $0.99, $1.00 will likely determine whether XRP recovers or extends losses over coming weeks.
What the data shows
Technical indicators showed weakness on the four-hour timeframe. According to CoinGape, the relative strength index stood at 32.29, just above the oversold threshold of 30, indicating potential exhaustion but not yet a confirmed reversal signal. The MACD was near minus 0.028 and below its signal line, consistent with weak momentum. XRP's seven-day decline of 14.50% indicated that selling pressure extended beyond a single session, according to Blockonomi citing CoinGecko data, which put 24-hour trading volume at $2.03 billion.
US spot XRP exchange-traded funds recorded net outflows on November 13. CoinGape reported $1.09 million in net outflows across the five-fund category. Grayscale's GXRP shed $5.54 million during the session, while Franklin Templeton's XRPZ attracted $4.45 million in inflows. Bitwise, Canary, and 21Shares posted zero net flows. Total trading in the category reached $22 million, with Bitwise accounting for $14.56 million. Cumulative net inflows for the category stood at $1.79 billion across $1.15 billion in net assets.
Background
XRP's recent decline occurred against a backdrop of broader cryptocurrency market stress. According to Finbold reporting, if the $0.80 target were reached, XRP would trade at levels unseen since Donald Trump's 2024 election victory. The token would have fallen 36% from its current levels and 65.96% from 2026 highs near $2.35. The cryptocurrency market itself contracted from a $2.6 trillion valuation at the start of November to $2.31 trillion as of November 13, wiping nearly $300 billion in value across the sector.
Support and resistance levels serve as technical reference points where trading activity typically clusters. When an asset sustains a move through either boundary, it can signal a change in the market's technical outlook. Blockonomi explained that traders monitor these levels because they represent areas where buyers or sellers have previously demonstrated conviction. For XRP, the $0.99 level marks the lower edge of a defined trading channel, while $1.55 represents the upper boundary that the token recently failed to penetrate.
What to watch
The $0.99 support level is the immediate focal point for traders. According to CoinGape, if this level fails, the next support on the four-hour chart sits at $0.95, with $0.85 positioned above Ali Charts' $0.80 target. On the upside, XRP must reclaim $1.00 to reset the technical picture. A close above that level would target $1.10 as the next resistance, according to technical analysis provided in the reports. The competing scenarios, a double-bottom reversal versus an extended correction, hinge on price action around this critical zone in coming sessions.
Questions readers ask
What is XRP's critical support level?
According to analyst Ali Charts, $0.99 represents the lower boundary of XRP's trading channel and the immediate support level being tested. CoinGape and Blockonomi both identified this area as critical; a sustained break below it could extend losses toward $0.80.
Why did XRP fall below $1?
A combination of liquidations in leveraged positions, broader cryptocurrency market weakness, and rising expectations for higher US interest rates all contributed. Bitcoin and Ether also declined significantly over the same period, indicating sector-wide selling pressure.
What could push XRP back up?
Analyst Crypto With Gopal noted that holding the $1.00 support zone could support a bullish double-bottom formation and trigger a reversal. A sustained move above $1.70 would be needed to target higher levels, though this remains a potential scenario rather than a confirmed outlook.